Meet the data (and Git)

Research Skills — Week 1 Application

Welcome back

Today’s goals

By the end of this session, you will have:

  1. Loaded real UK energy data in (Web)R
  2. Made your first plots of the biomass story
  3. Summarized data, in context
  4. Committed your first .R file to GitHub

Questions?

Submit questions:

PollEv.com/geol

text geol to 07480 781235

The biomass question

“Does UK biomass power help reach net zero, and should we keep paying for it?”

This week: explore the data. Get a feel for the numbers.

Next week: make proper figures and start making the case.

First steps in WebR

🎓💻 Guided walkthrough
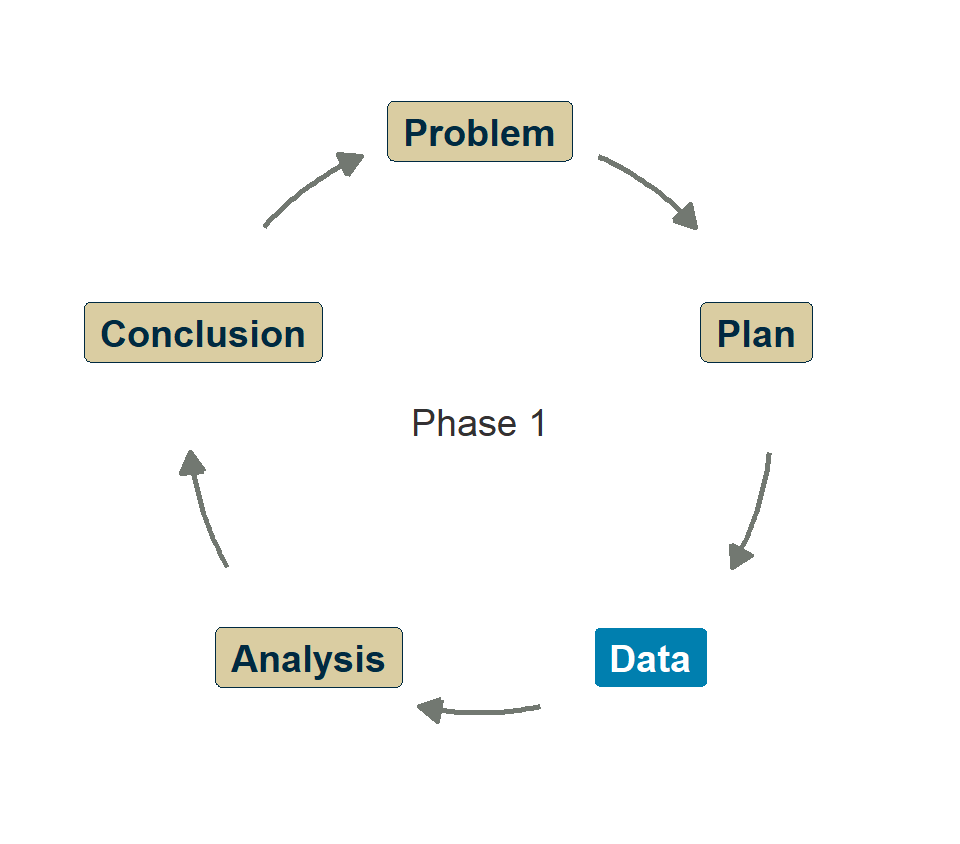
The PPDAC cycle drawn as a ring: Problem, Plan, Data, Analysis, Conclusion, with arrows running clockwise back to Problem. Data is highlighted; the centre reads Phase 1.

Open the course page

🖥️ Navigate to the Week 1 exercise page

Loading the data

  • What are the columns?
  • What years does it cover?
  • What units are used?

A first plot

“What’s the first thing you notice?”

Independent exercises

✏️💻 Exercises 2–5

Work through the exercises

The WebR page has scaffolded exercises with hints.

Aim for at least exercises 1–4:

  1. ✅ Inspect the dataset
  2. Plot bioenergy generation over time
  3. Add coal to the same plot — what do you see?
  4. Calculate mean and SD of bioenergy for the last 5 years
  5. What fraction of UK electricity was bioenergy in the most recent year?

Then the quick check: how many times more bioenergy in 2025 than 2000?

Finished early? Try the extension exercises.

Git

📋🎓💻 Setting up your repo

Why Git?

Your code needs to be:

  • Saved — not just in the browser
  • Versioned — so you can go back if something breaks
  • Visible — so you can share your progress

Git does all three. GitHub Desktop makes it painless.

The workflow

Every session:

  1. Open GitHub Desktop
  2. Pull any changes
  3. Do your work in .R files
  4. Commit with a message
  5. Push

That’s it.

Your commit history becomes your learning record.
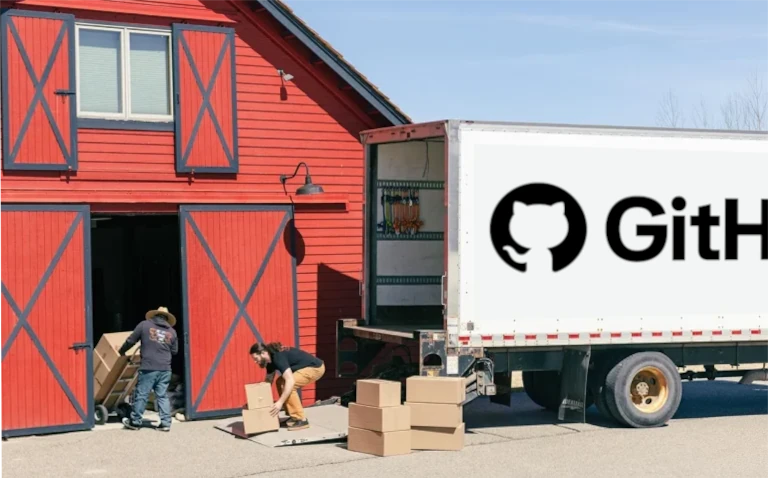
Two people loading cardboard boxes onto a white removals lorry parked outside a red barn.

Committing loads the van; pushing sends it to the depot.

Live demo

🖥️ Switching to GitHub Desktop

  1. Accept the assignment: biomass
  2. Clone your personal repo in GitHub Desktop
  3. Open the folder — see the starter files
  4. Create week1.R — paste your WebR code
  5. In GitHub Desktop: see the change → commit → push

Your turn

✏️📋 Clone, commit, push

Do it yourself

  1. Clone your personal repo via GitHub Desktop
  2. Create week1.R — paste your best code from WebR
  3. Commit with a descriptive message
  4. Push to GitHub

Raise your hand when you’ve pushed successfully.

Attendance

Discussion

💬 What did you find?

What did the data show?

“What did you find in the data?”

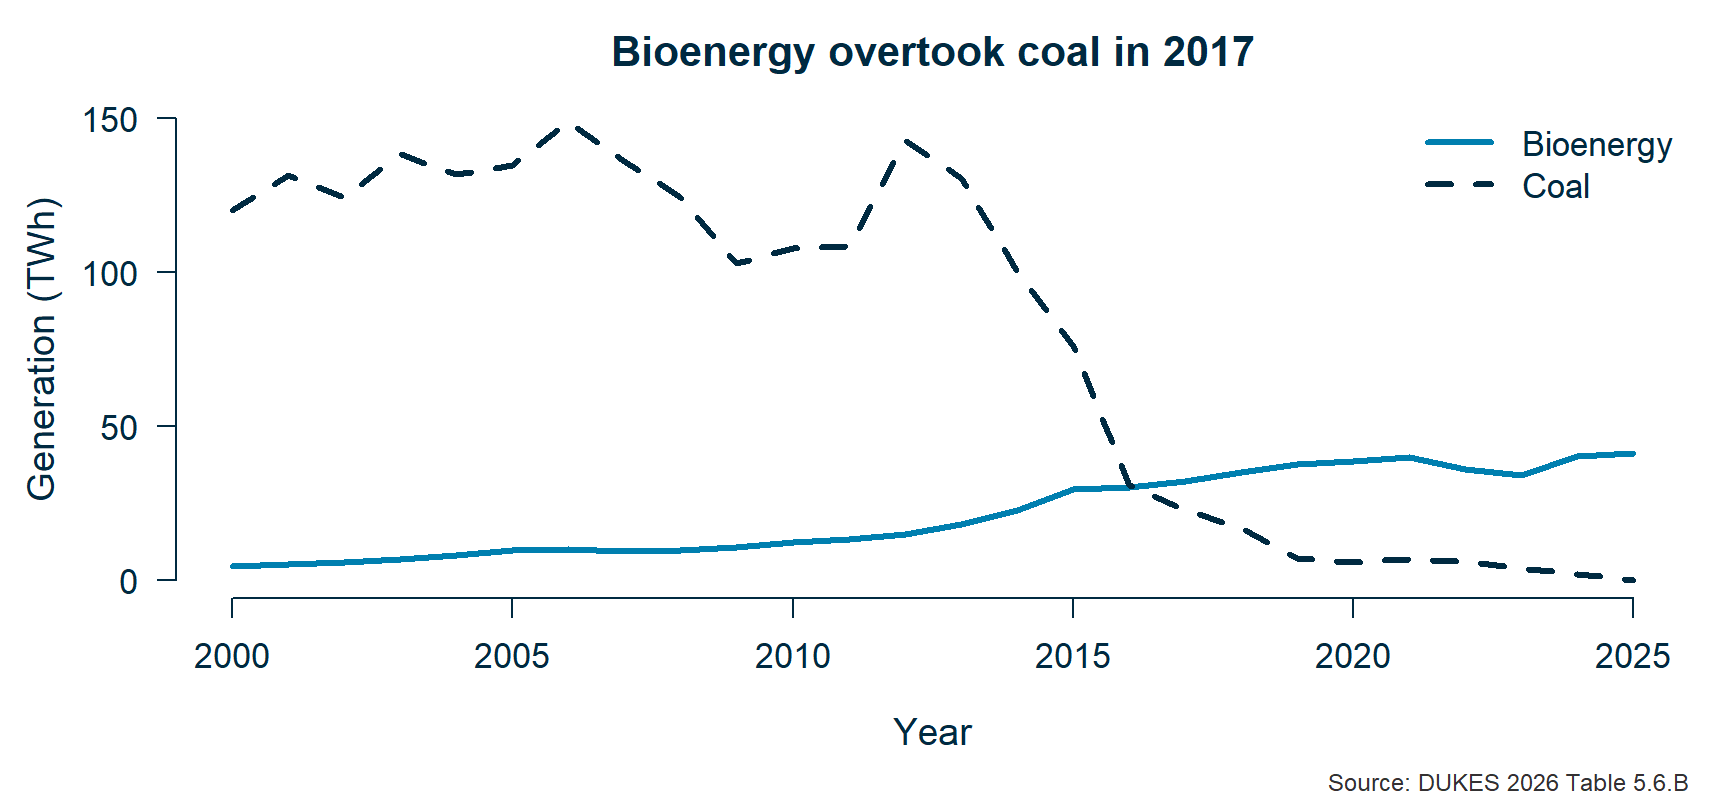
  • Bioenergy grew about ninefold, then plateaued
  • Coal has collapsed
  • Bioenergy is now about 14% of UK electricity

Coal out, bioenergy in

UK coal and bioenergy generation, 2000 to 2025. Coal runs above 100 TWh until 2012, then falls away to zero. Bioenergy climbs steadily from about 4 to about 41 TWh. The two lines cross between 2016 and 2017.

One more question

“If biomass is counted as zero-carbon, what happens to the UK’s official emissions figures?”

We’ll dig into this next week.

Wrap-up

Any questions we missed?

Submit questions:

PollEv.com/geol

text geol to 07480 781235

Stuck? Ask the class

The class discussion board: the “Ask for help” link or https://github.com/orgs/geol-skills/discussions

  • Private to the class and staff
  • Your question is someone else’s question too
  • Include what you tried, your code, and the full error
  • Solved? Mark with a ✅ so others can see what helped

Now: reply to Introduce yourself

Before you leave

Next time: “What do the numbers say?”

You’ll learn ggplot2 and start asking: “Is that a big number?”