What makes a good question?

Research Skills — Week 1

Research Skills for Geoscientists

Welcome!

  • The scientific method
  • Testable or not?
  • Falsifiability
  • Meet R
  • The biomass question
  • Wrap-up

Who am I?

I’m Martin Smith, and I’m a palaeontologist.
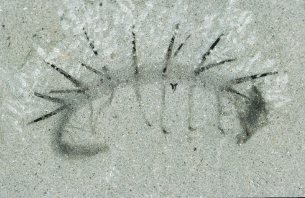
A fossil of Hallucigenia sparsa on grey shale: a worm-like body with a row of dark spines along its back and slender legs beneath.

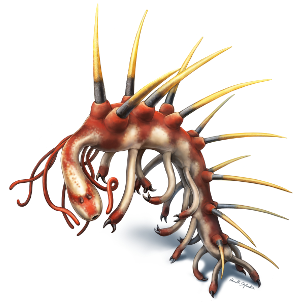
Colour reconstruction of Hallucigenia: a red, worm-like animal with paired legs below and long yellow-tipped spines along its back.

Hallucigenia sparsa, Burgess Shale, ~508 million years old.
Fossil: NMNH 198658, Smithsonian; photo Martin Smith.
Reconstruction: Danielle Dufault
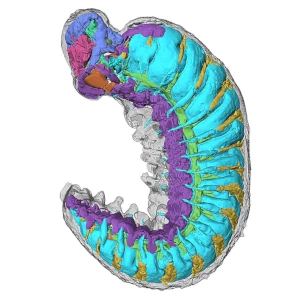
3D model of the internal organ systems of the Cambrian lobopodian Youti.

Youti yuanshi: internal organs reconstructed from X-ray scans.
Model: Emma Long

Testing hypotheses needs statistics

I test hypotheses, and I have to communicate the results to convince others. So I write R packages:

New methods for research

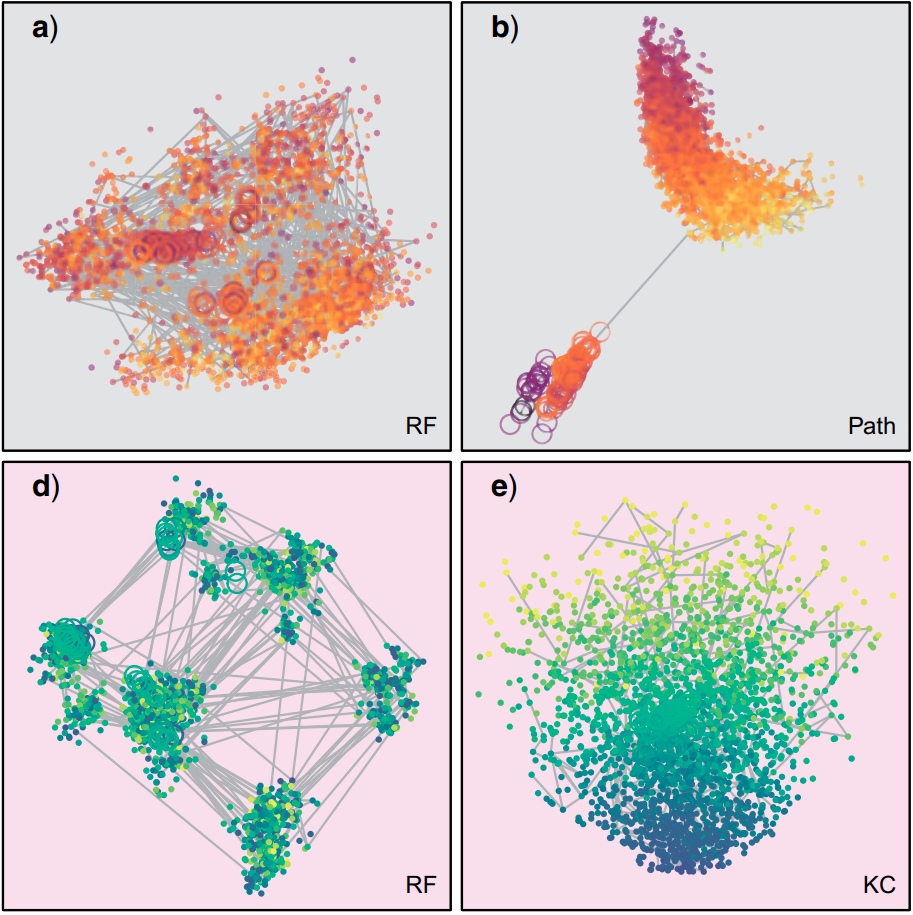
Four panels mapping phylogenetic tree space: each tree is a dot, joined by a minimum spanning tree. Depending on the distance measure used (RF, Path, KC), the same trees form distinct clusters or one diffuse cloud.

Mapping tree space with TreeDist.
Smith 2022, Systematic Biology, CC BY 4.0

Data visualization

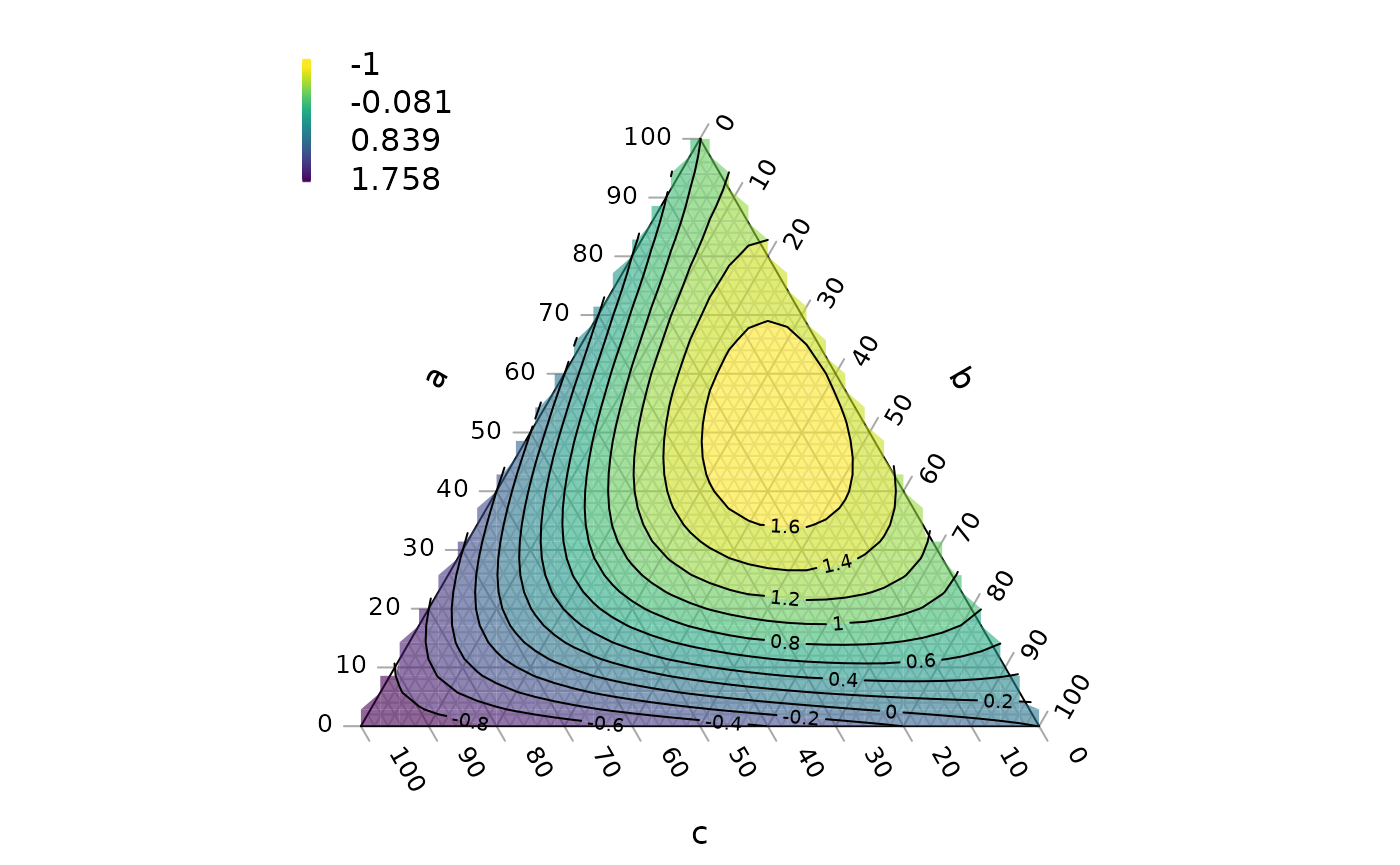
A ternary plot: a triangle whose three axes run from 0 to 100, filled with coloured, labelled contours of a function across the triangle.

Contoured ternary plot: Ternary

Skills for all of life

My spin-out, StratoBayes:

Our subcontractors use the same tool suite you will learn this term.
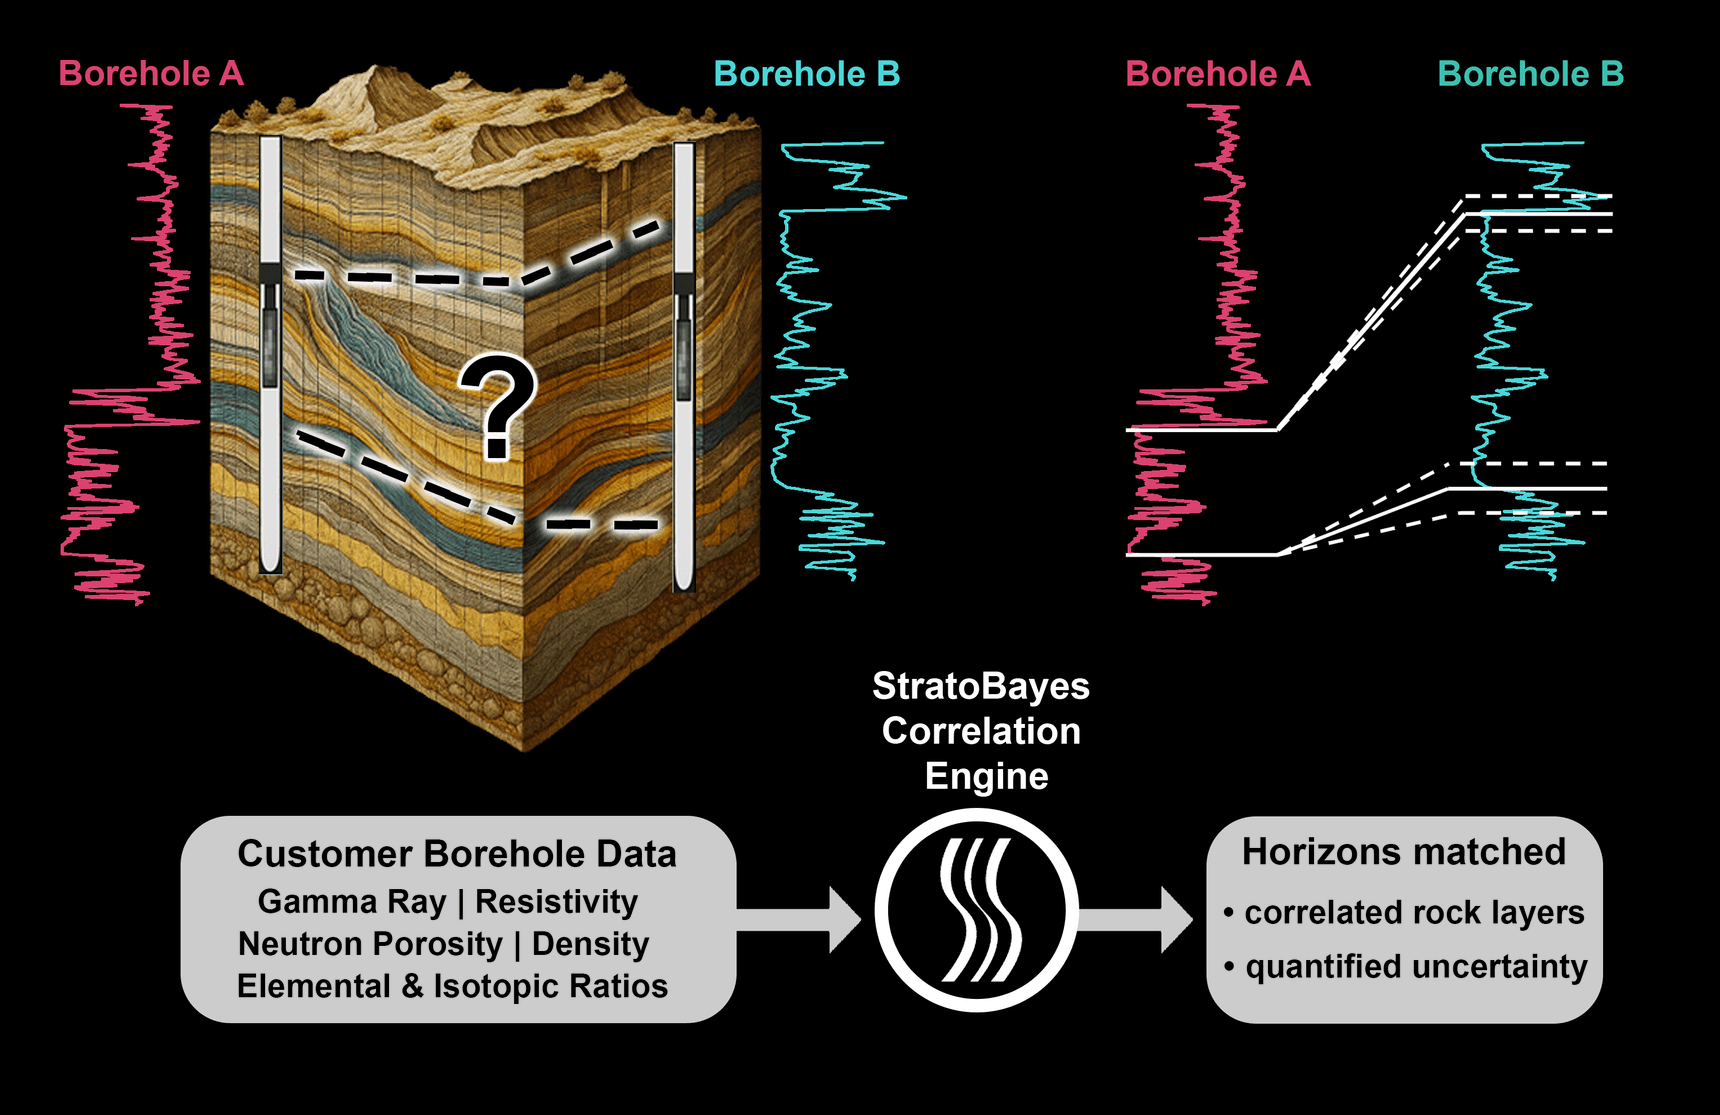
StratoBayes illustration on a black background: gamma-ray logs from two boreholes either side of a block of layered rock feed the StratoBayes correlation engine, which returns the same logs with matching horizons linked and their uncertainty shown.

© StratoBayes; illustration by Kilian Eichenseer

In demand in industry

Research Skills for Geoscientists

This module is about learning to design experiments, and to communicate what their results really mean. This, in a word, is: Science!

Two strands:

  1. Statistics — how to test claims with data
  2. Communication — how to present evidence so it can be trusted

This term: Quantitative data

Next term: Spatial data

How to succeed

20 credits = 200 hours = 10 hours per week.

Each week: Content session (2 h) + Application session (2 h)

  • Do. Per ardua ad astra!

View from a Lancaster cockpit past two propellers, with other Lancaster bombers flying above the clouds.

No. 50 Squadron Lancasters, 1943.
RAF official photographer / IWM TR 1158, public domain

  • Read (and listen)
  • Ask
  • Use AI intelligently (if at all)

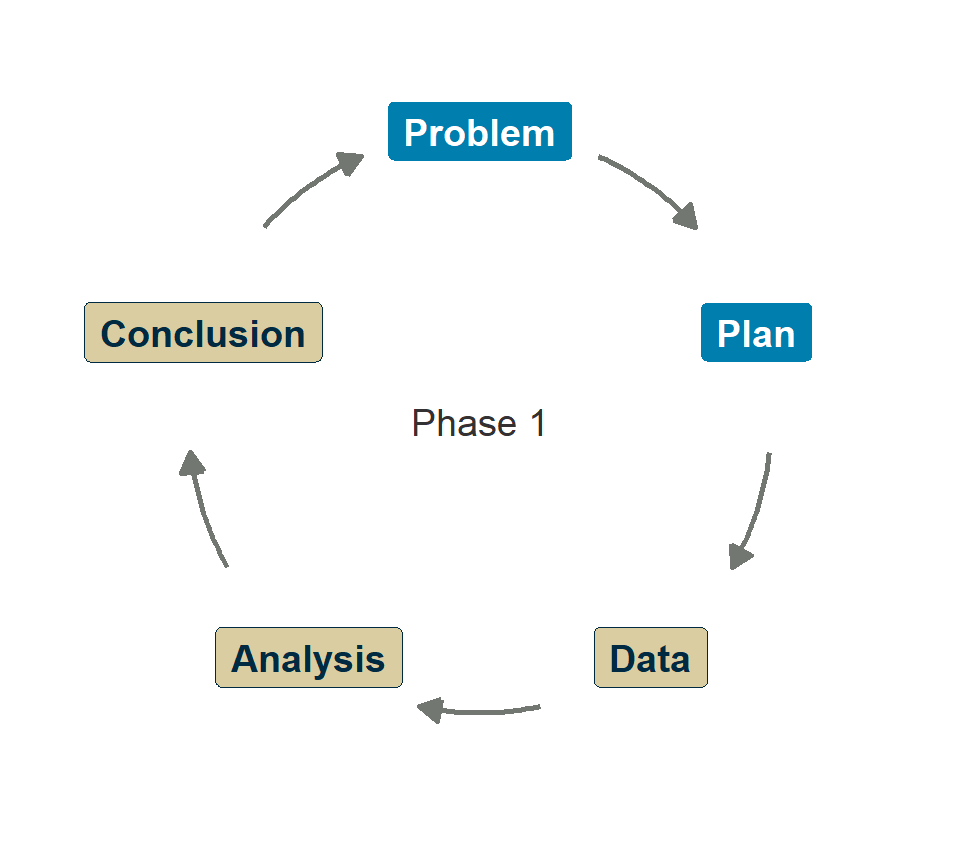
Two phases

Phase 1 (Weeks 1–4)

Scaffolded mini-project:

“Does UK biomass power help reach net zero, and should we keep paying for it?”

Real data & ambiguity.

Culminates in a peer-reviewed policy briefing.

Phase 2 (Weeks 5–10)

Your investigation:

Choose a sustainable energy question. Design the study. Analyse the data. Write a 2,000-word policy report.

This is your summative assessment (30%).

Building on what you have already learned

GEOL1151 taught you to code in Python, use Jupyter, and work with data.

This module uses R instead of Python.

Why? R is built for statistics. It uses the same ideas and concepts, but with a different syntax. Pre-term preparation has helped you to make the jump.

Questions?

Submit questions:

PollEv.com/geol

text geol to 07480 781235

The scientific method

  • Research Skills for Geoscientists

🎓 Concept block 1

  • Testable or not?
  • Falsifiability
  • Meet R
  • The biomass question
  • Wrap-up

What is science?

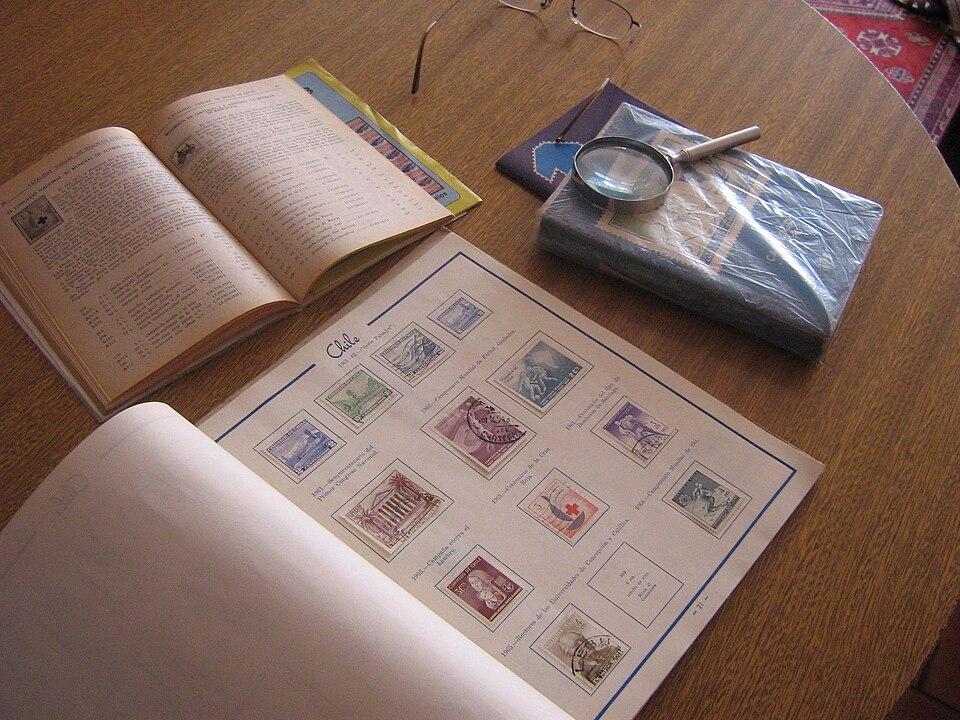
An open stamp album with a page of mounted Chilean stamps, beside a stamp catalogue and a magnifying glass.

“All science is either physics or stamp collecting” (attrib. Rutherford)
Penarc, CC BY 3.0

  • Not a body of facts
  • A process for reducing uncertainty
  • Nothing is ever “proven”
    • Instead, we accumulate and evaluate evidence

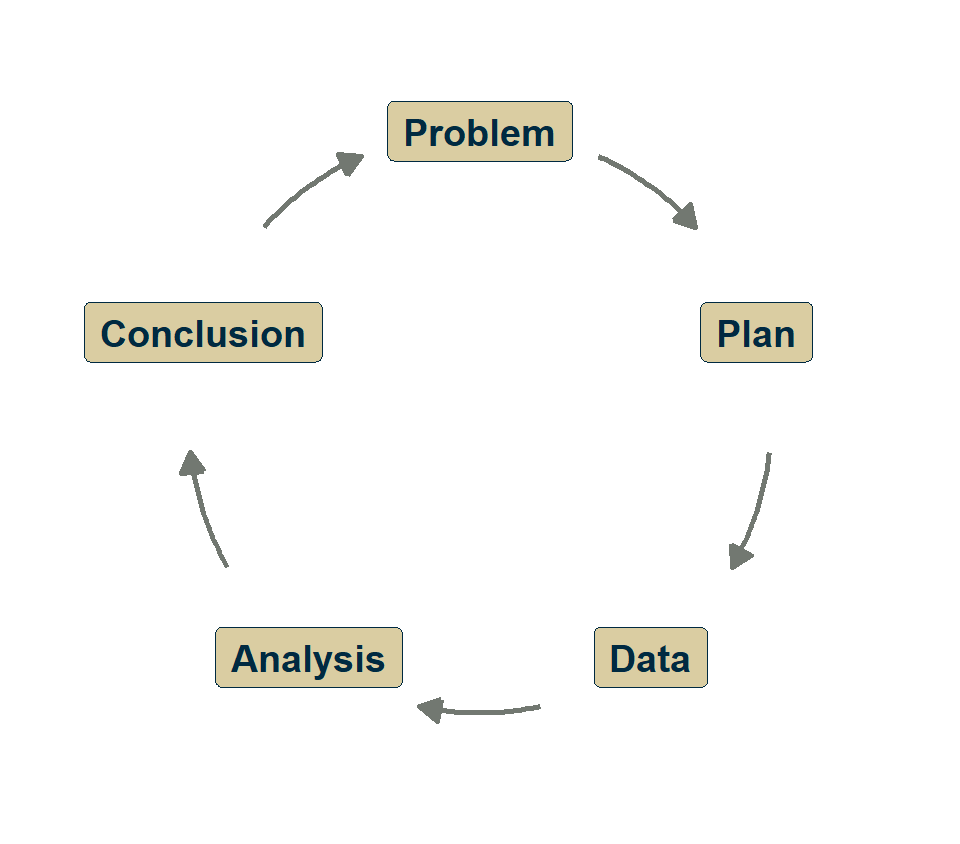
The cycle

Problem → Plan → Data → Analysis → Conclusion
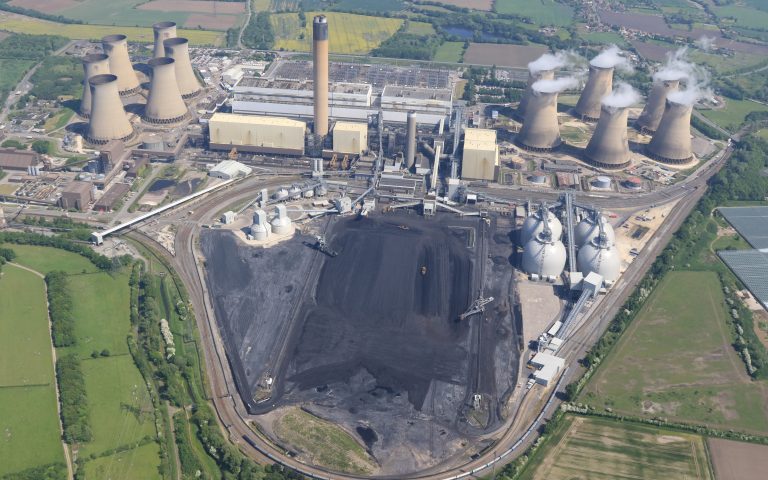
Aerial view of Drax power station, showing large volume of coal in open storage (centre) alongside four biomass storage drums (spheres to left)

Drax power station. © Drax

Two directions of reasoning

Deductive

General → Specific

If plate tectonics is correct, then we predict matching fossils on separated continents.

We test the prediction.

Inductive

Specific → General

We observe matching fossils on separated continents. We infer the continents were once joined.

We build toward a theory.
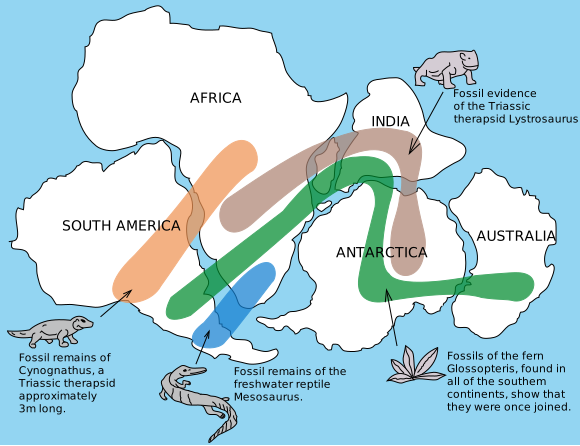
Map of the Gondwana supercontinent reassembled. Bands marking the fossil ranges of Cynognathus, Mesosaurus, Lystrosaurus and Glossopteris run continuously across the present-day coastlines of South America, Africa, India, Antarctica and Australia.

USGS, public domain

Wegener’s continental drift

  • 1912: Wegener induces that continents move, from fossils, rock belts and glacial deposits that match across oceans
  • He also proposes a mechanism: forces from Earth’s spin and tides
  • Physicists deduce those forces are far too weak: mechanism refuted
  • Most geologists throw out the drift along with the mechanism

The lesson: test each claim against its own evidence.

Map of the Gondwana supercontinent reassembled. Bands marking the fossil ranges of Cynognathus, Mesosaurus, Lystrosaurus and Glossopteris run continuously across the present-day coastlines of South America, Africa, India, Antarctica and Australia.

USGS, public domain

Testable or not?

  • Research Skills for Geoscientists
  • The scientific method

✏️ Exercise 1

  • Falsifiability
  • Meet R
  • The biomass question
  • Wrap-up

Instructions

I’ll show you some statements.

For each one, decide: Is this a testable hypothesis?

  • What predictions does the hypothesis make?
  • What observations would / would not be consistent with the hypothesis?
  • What data / evidence could be collected to test it?

Think for 30 seconds, then discuss as a desk.

“The Earth is approximately 4.5 billion years old”

Testable, and extensively tested (radiometric dating, meteorite & Lunar ages, astronomical evidence).

“Earthquakes are caused by divine punishment”

Not testable as stated — no observable prediction that distinguishes this from natural causes.

“Wind turbines cause headaches in nearby residents”

Testable — but tricky. How do you control for the nocebo effect? Awareness bias? The design of the study matters enormously.

“CO₂ emissions from burning biomass should be counted as zero”

Testable? It depends.

  • What timescale?
  • What system boundary?
  • “Carbon-neutral” is partly a scientific claim and partly a policy choice.

This question underpins our first four weeks.

Falsifiability

  • Research Skills for Geoscientists
  • The scientific method
  • Testable or not?

🎓 Concept block 2

  • Meet R
  • The biomass question
  • Wrap-up

Popper’s perspective

We can never prove a theory.

We can only fail to disprove it.

Every test that could have disproven our hypothesis but didn’t makes us a little more confident — but never certain.
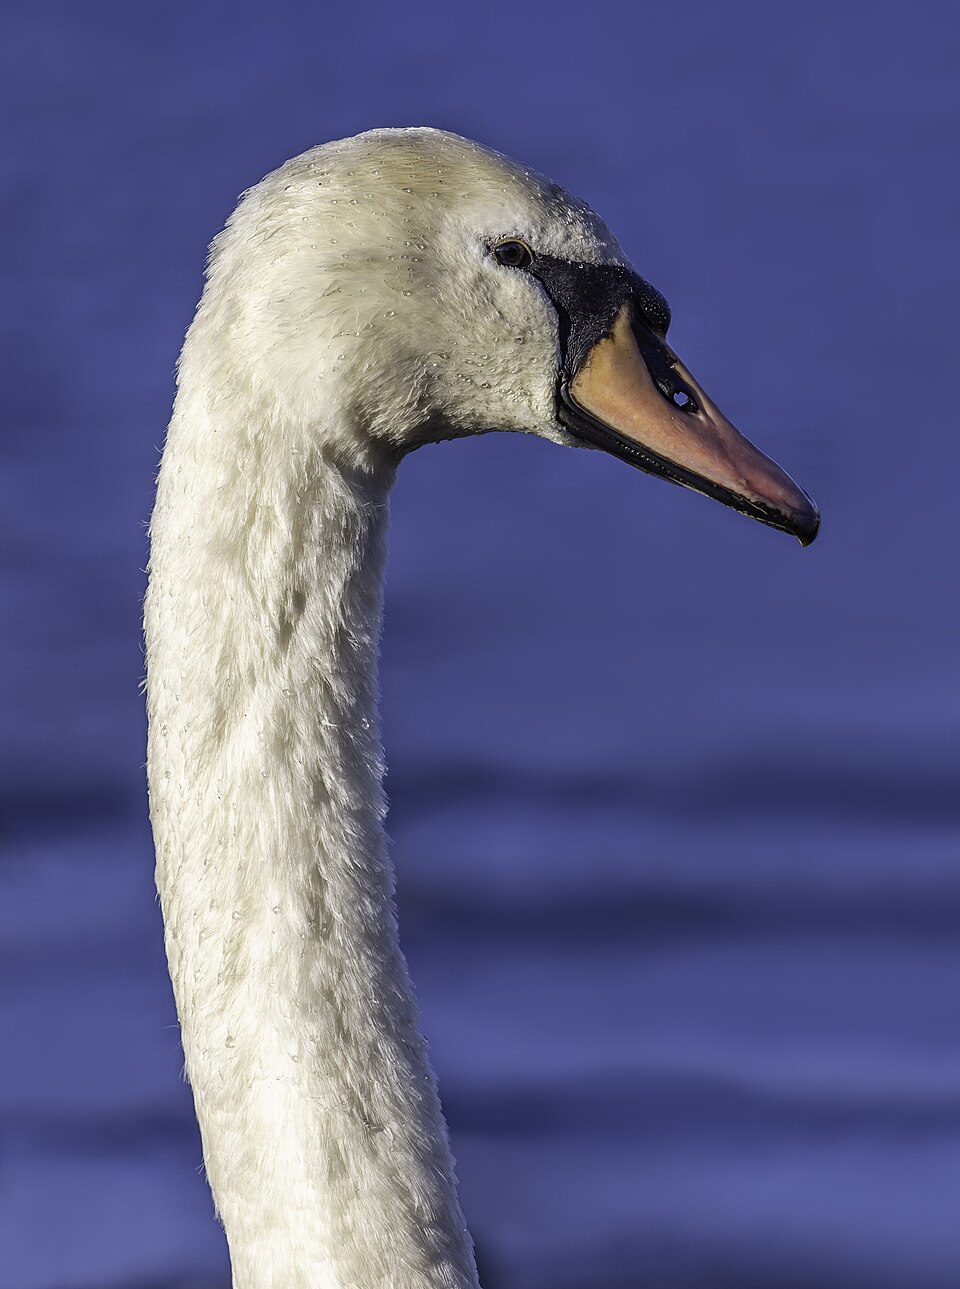
Head and neck of a white mute swan against blue water.

Mute swan, Windermere
Michal Klajban, CC BY-SA 4.0

The Wason selection task

Each card has a letter on one side and a number on the other.

Rule: “If a card shows a vowel, then the other side has an even number.”

A

K

4

7

Which cards must you turn over to test the rule?

QR code linking to PollEv.com/geol

Vote at PollEv.com/geol

or text geol to 07480 781235

Poll results

Wason selection task

Each card has a letter on one side and a number on the other.

Rule: “If a card shows a vowel, then the other side has an even number.”

A ✓

K ✗

4 ✗

7 ✓

A (vowel): if the other side is odd, the rule is broken

K (consonant): the rule says nothing about consonants

4 (even): Neither consonant-even nor vowel-even would disprove the rule

7 (odd): if the other side is a vowel, the rule is broken

Confirmation bias

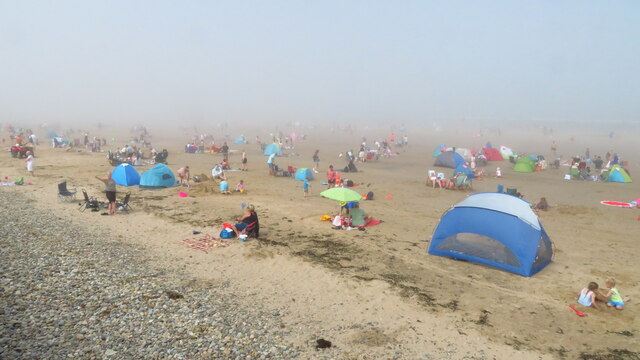
A crowded beach shrouded in grey sea fog, with holidaymakers, beach tents and a lone umbrella fading into the murk.

Bank holidays… always a washout?
Sea haar at Saltburn-by-the-Sea.
Colin Park / Geograph, CC BY-SA 2.0

Humans are wired to confirm, not disconfirm: we seek evidence for what we already believe.

Useful hypothesis tests push back against this tendency.

In this module, you’ll learn to:

  • Ask “what evidence would change my mind?”
  • Seek comparisons, not just supporting cases
  • Treat uncertainty as information, not failure

Meet R

  • Research Skills for Geoscientists
  • The scientific method
  • Testable or not?
  • Falsifiability

🎓💻 Concept block 3

  • The biomass question
  • Wrap-up

Why R?

You know Python (NumPy, Jupyter, pandas)

Same ideas. Different syntax.

R is built for statistics

  • t.test(), lm(), aov() — one line each
  • ggplot2 — the grammar of graphics
  • Built-in data manipulation

You’ll see why this matters starting in Week 2.

R demo

The biomass question

  • Research Skills for Geoscientists
  • The scientific method
  • Testable or not?
  • Falsifiability
  • Meet R

✏️💬 Integrative exercise

  • Wrap-up

Context

The UK burns millions of tonnes of imported wood pellets for electricity.
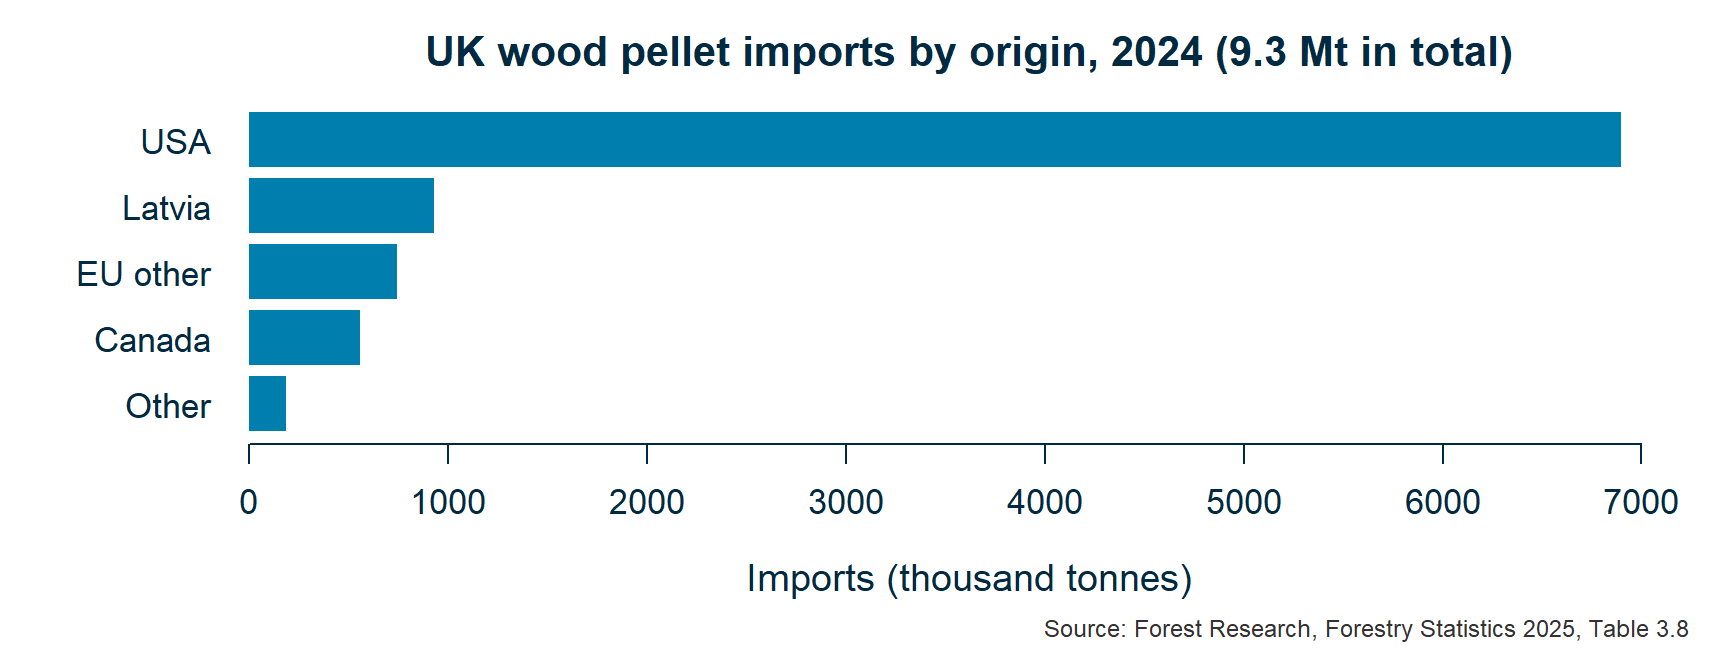
Most come from forests in the southeastern United States.

Horizontal bar chart of 2024 UK wood pellet imports by origin. The USA bar, near 6,900 thousand tonnes, dwarfs Latvia at about 930, EU other at 745, Canada at 559 and Other at 186. The total is 9.3 million tonnes.

Under international carbon accounting rules, the CO₂ released at the chimney is counted as zero.

Is that reasonable?

Discuss as a desk. You have 10 minutes.

  1. Write one testable hypothesis about biomass energy
  2. What data would you need to test it?
  3. What evidence would disprove your hypothesis?

Attendance

What you came up with

Wrap-up

  • Research Skills for Geoscientists
  • The scientific method
  • Testable or not?
  • Falsifiability
  • Meet R
  • The biomass question

Key points

  1. Science is a process for reducing uncertainty, not a collection of facts
  2. We test hypotheses by seeking disconfirmation, not confirmation
  3. The biomass question — does it help reach net zero? — is genuinely open, and the answer depends on choices you’ll learn to identify

Any questions we missed?

Submit questions:

PollEv.com/geol

text geol to 07480 781235

Next time

Application session: “Meet the data (and Git)”

You’ll:

  • Load real UK energy data in WebR
  • Make your first plots
  • Set up your GitHub repo and make your first commit

If you haven’t done the pre-term preparation, do it before the next session.