Making the biomass case

Research Skills — Week 2 Application

Today’s plan

  • Chart audit
  • Guided walkthrough
  • Your figures
  • Discussion
  • Wrap-up

Goals

Produce briefing-quality figures of the biomass data.

By the end of this session:

  • 2–3 committed figures in your repo
  • The code that produced them
  • A sense of the story the data tells

Questions?

Submit questions:

PollEv.com/geol

text geol to 07480 781235

The figures you’re building

Figure What it shows
Trend plot Biomass generation over time
Comparison plot CO₂ per MWh: biomass vs coal vs gas
Import plot Where do the wood pellets come from?
Context plot Biomass as % of total UK electricity

Chart audit

  • Today’s plan

💬 Homework follow-up

  • Guided walkthrough
  • Your figures
  • Discussion
  • Wrap-up

Hall of shame: the satisfaction pyramid
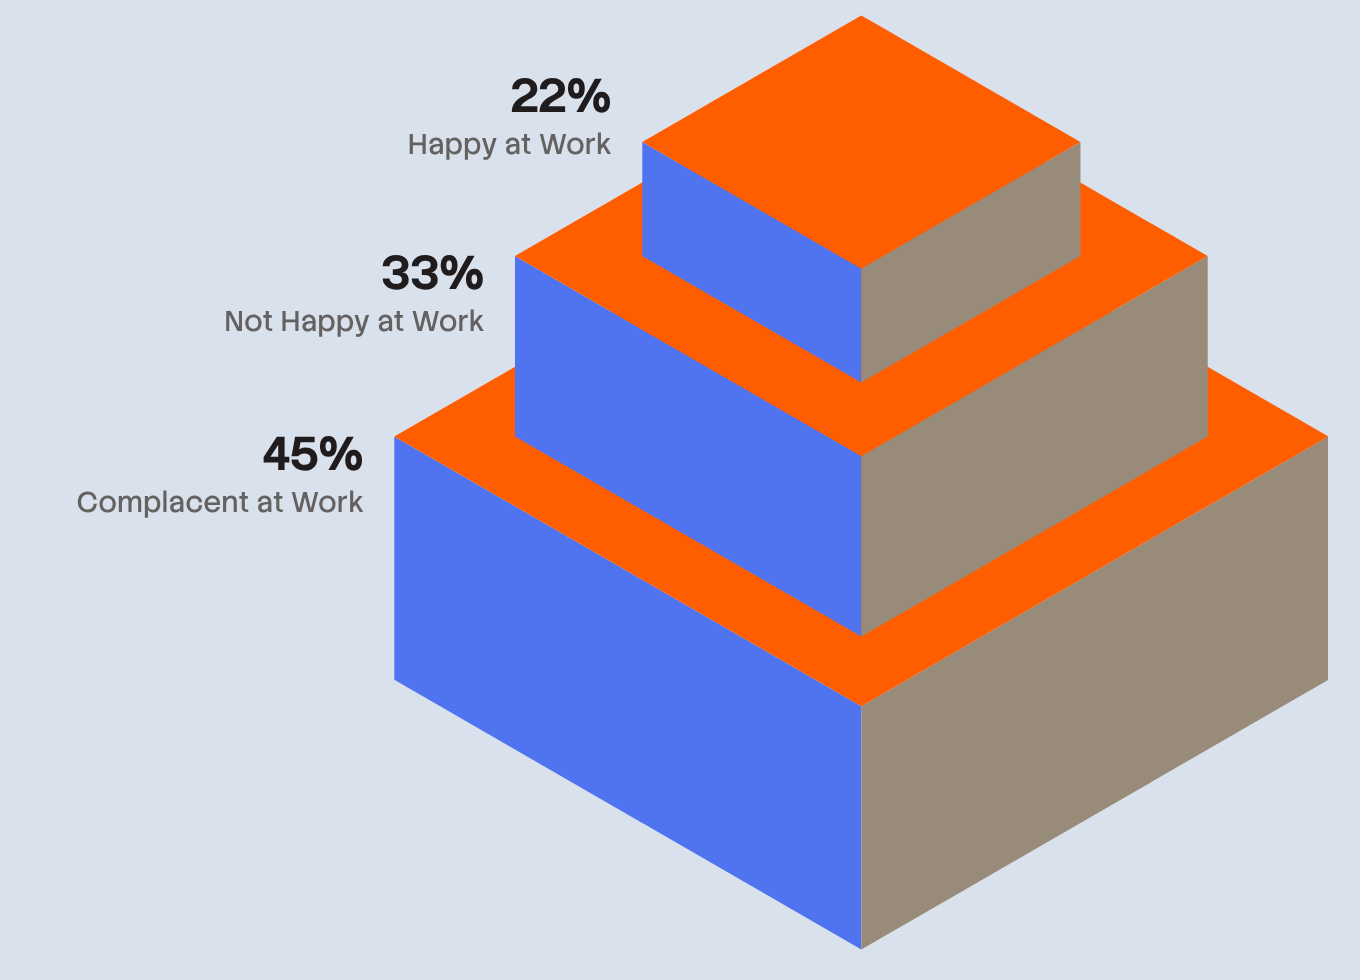
Stepped 3D pyramid with three tiers labelled 22% happy at work, 33% not happy at work and 45% complacent at work.

Volume encodes nothing: the 45% tier looks many times the size of the 22% one. And “not happy” sits between happy and complacent.

Hall of shame: two cubes
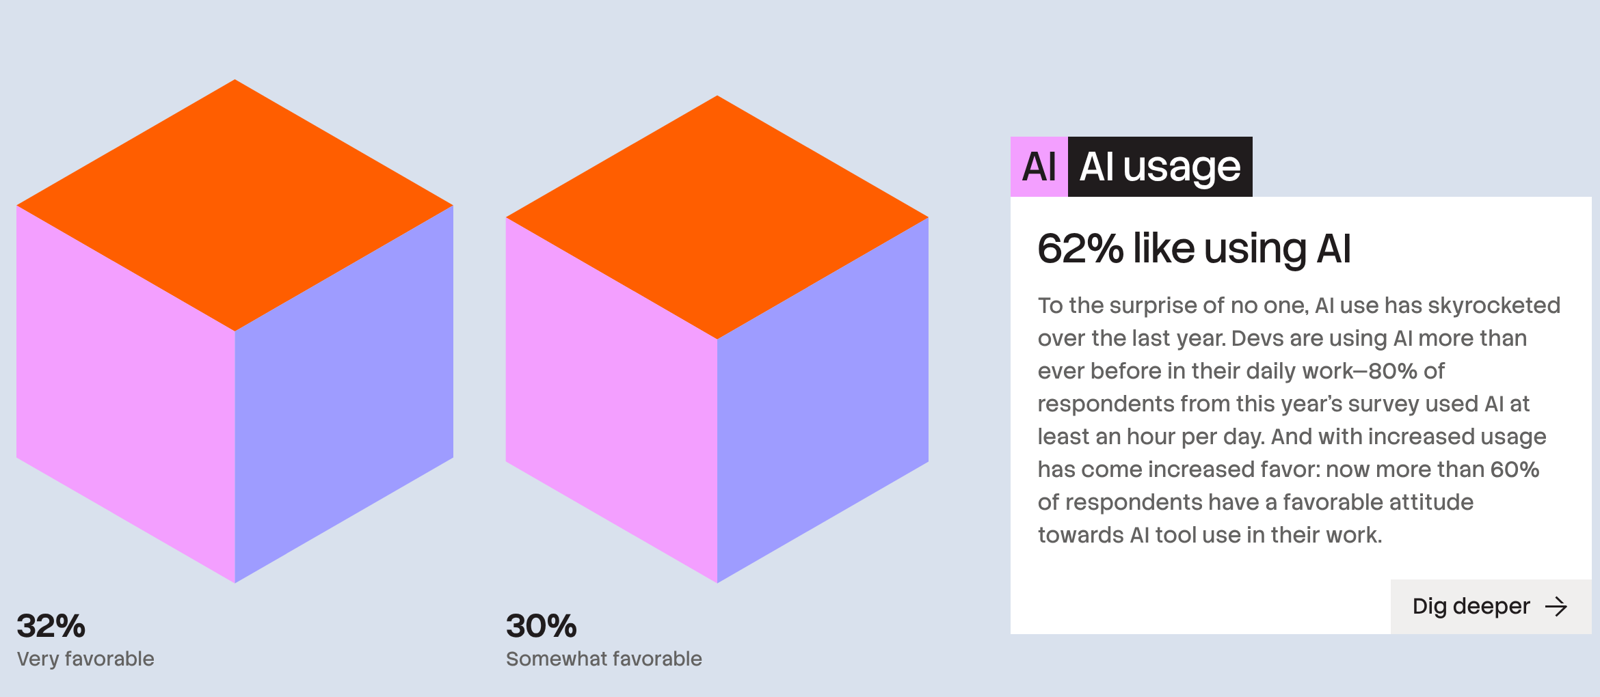
Two identical cubes labelled 32% very favourable and 30% somewhat favourable, beside the headline 62% like using AI.

Two cubes the same size, for 32% and 30%. Where are the other 38%? And only 14,428 of the 30,903 respondents answered.

Hall of shame: the treemap
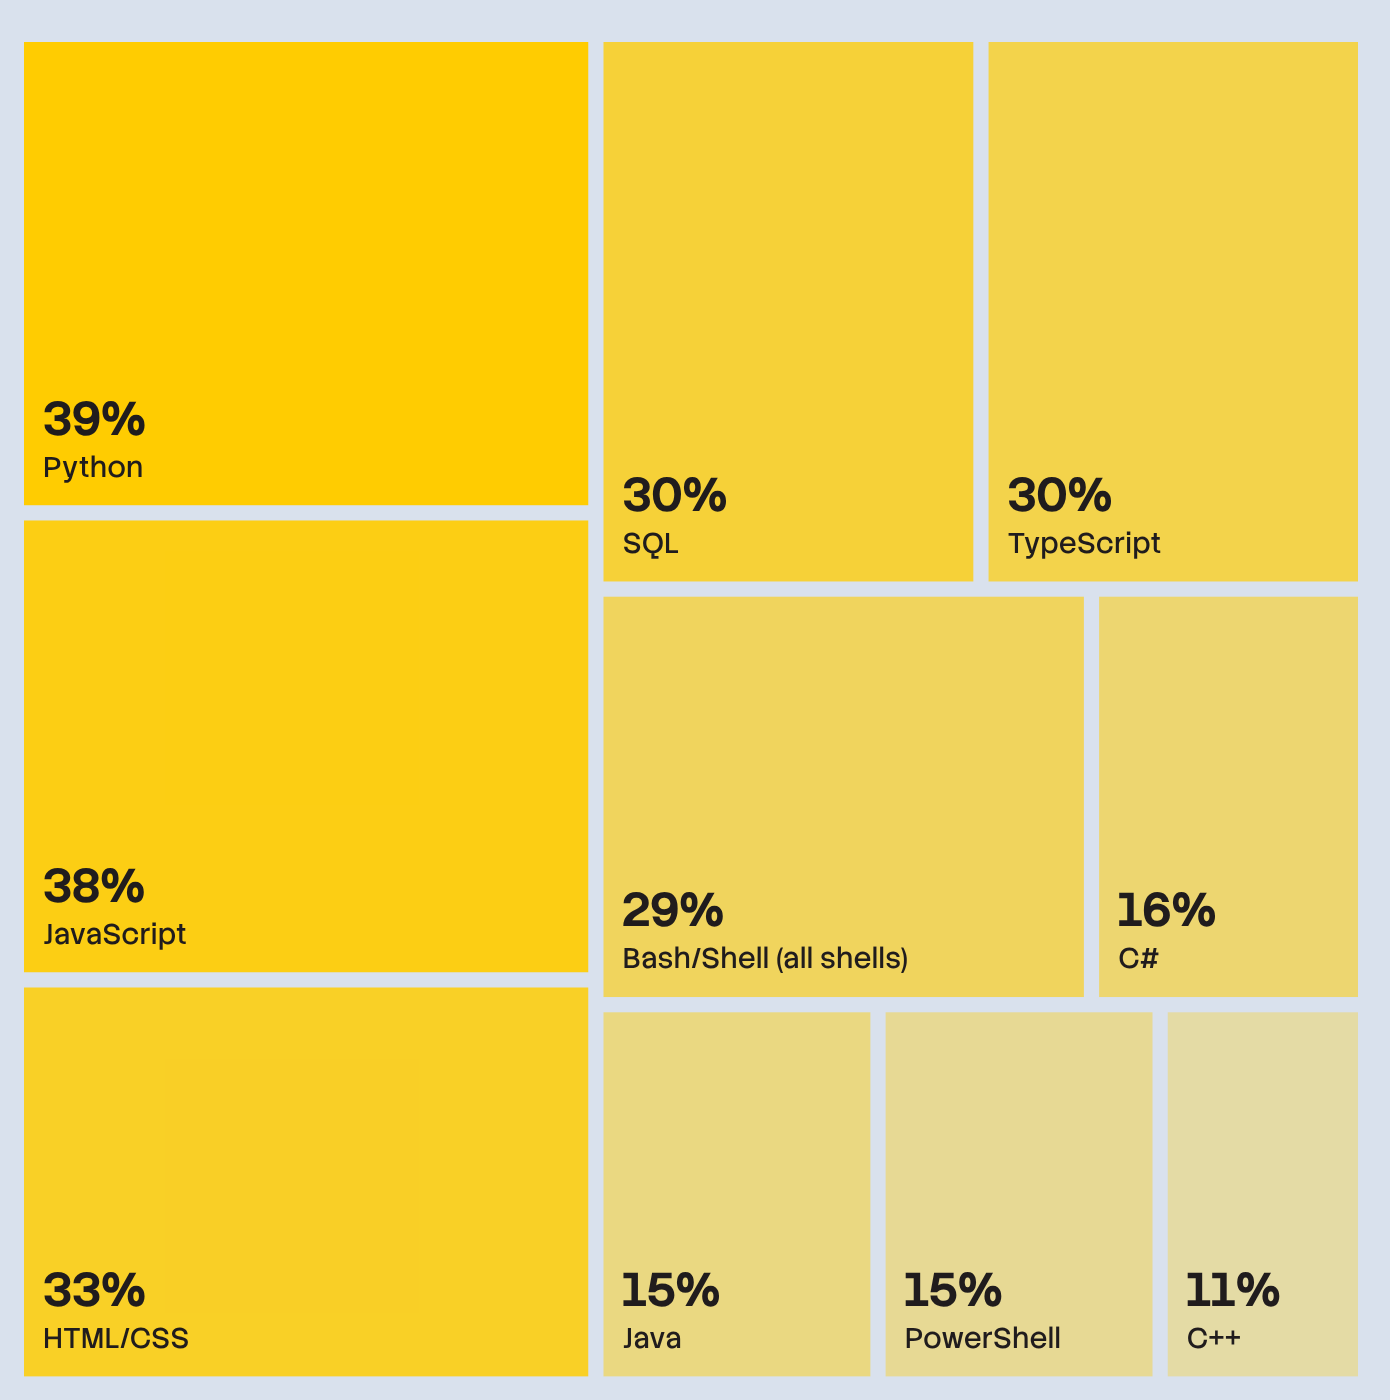
Treemap of yellow rectangles: Python 39%, JavaScript 38%, HTML/CSS 33%, SQL 30%, TypeScript 30%, Bash/Shell 29%, C# 16%, Java 15%, PowerShell 15%, C++ 11%.

The parts add up to 296%. Respondents could pick several languages, so these aren’t shares of a whole.

Hall of shame: the language pyramid
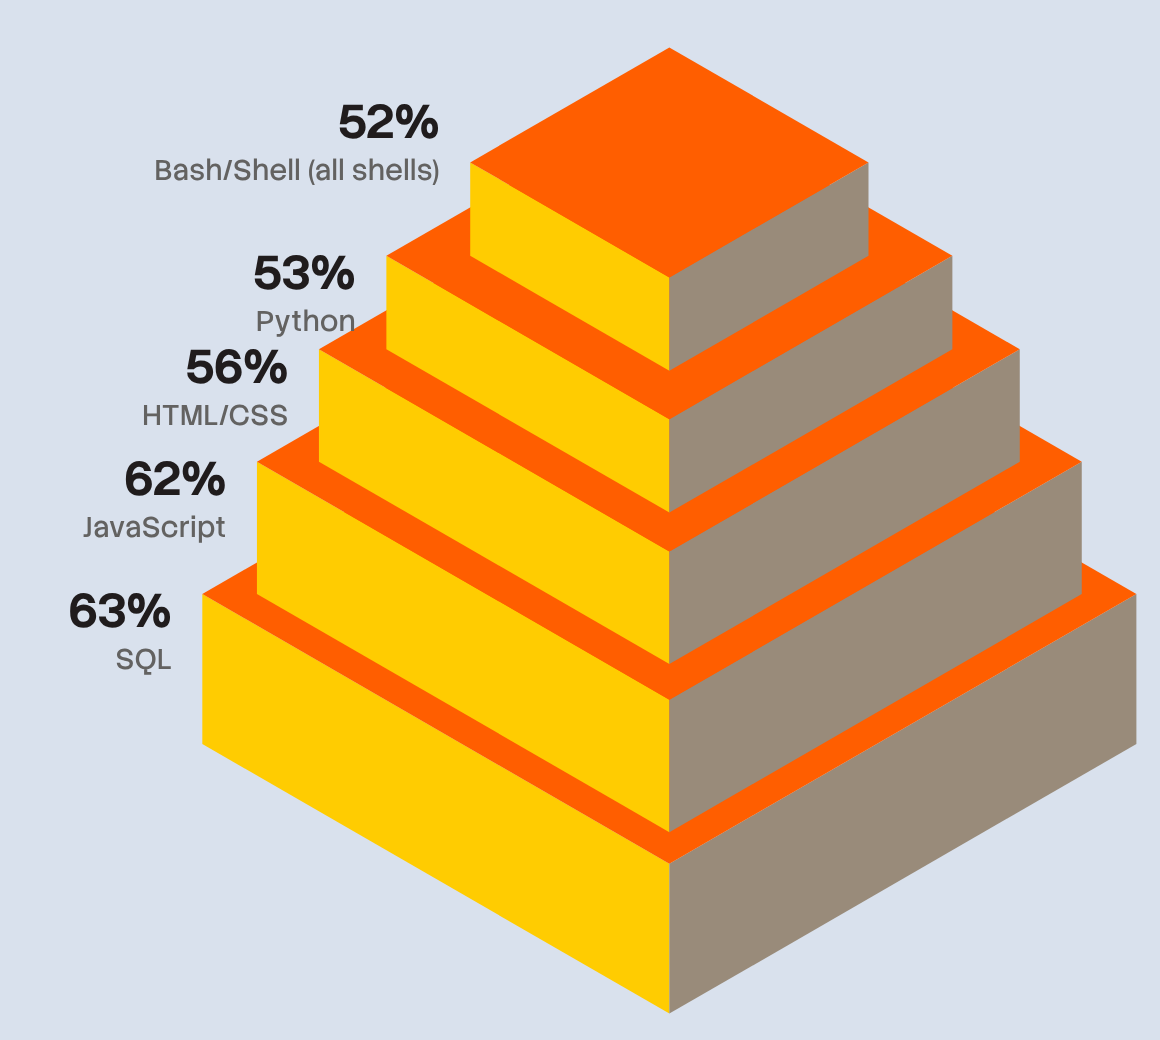
Stepped 3D pyramid with five tiers labelled from the top: Bash/Shell 52%, Python 53%, HTML/CSS 56%, JavaScript 62%, SQL 63%.

52% sits on top of 63%, and the tiers shrink far faster than the numbers. A pyramid implies a hierarchy that isn’t there.

The same data, done properly
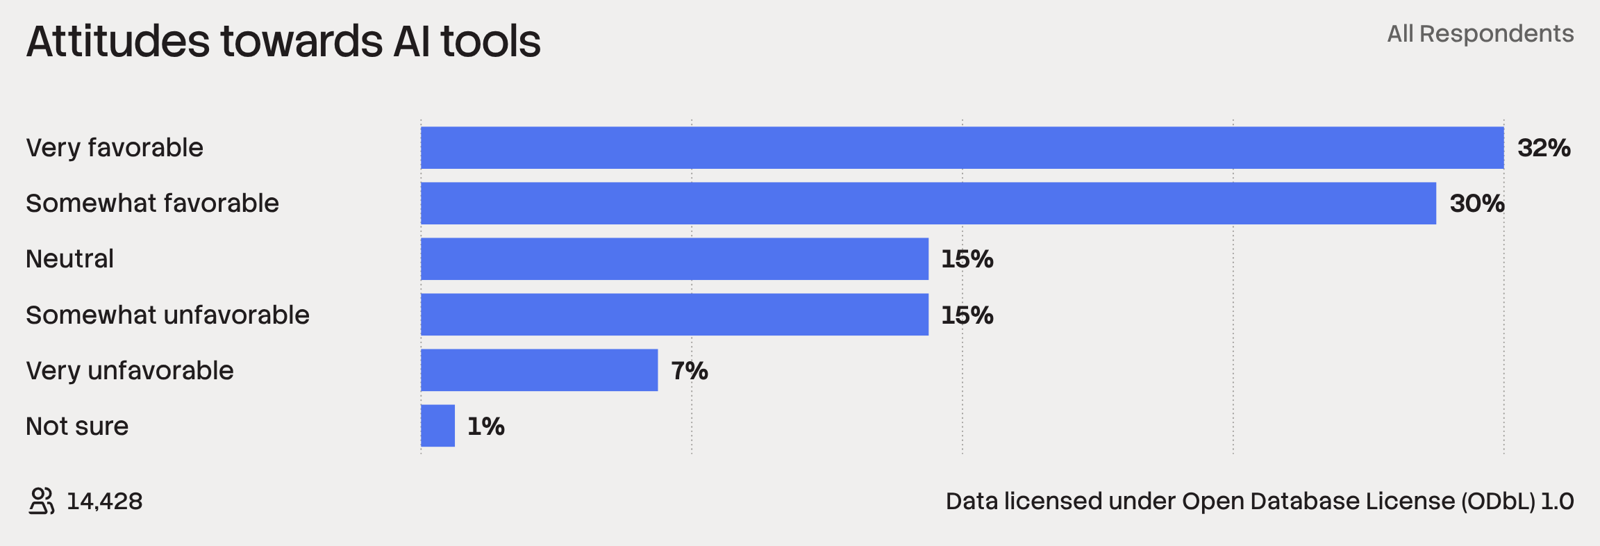
Horizontal bar chart, Attitudes towards AI tools: very favourable 32%, somewhat favourable 30%, neutral 15%, somewhat unfavourable 15%, very unfavourable 7%, not sure 1%. The responder count, 14,428, and the data licence are shown.

Every answer shown, in scale order, every bar labelled, n stated. Their caption even says: “This is not proof … but they are certainly related.”

Guided walkthrough

  • Today’s plan
  • Chart audit

🎓💻 Building a biomass figure

  • Your figures
  • Discussion
  • Wrap-up

Live demo

🖥️ Building a multi-fuel line chart in WebR

The anatomy of a good figure

Every figure should have a “so what” — what should the reader take from it?

Your figures

  • Today’s plan
  • Chart audit
  • Guided walkthrough

✏️💻 Independent exercises

  • Discussion
  • Wrap-up

Work through the exercises

The WebR page has four main exercises with hints:

  1. Trend plot — biomass over time, with context
  2. Comparison plot — emissions per MWh by fuel
  3. Import plot — pellet origins over time
  4. Context plot — biomass as % of total

Extension: Can you make biomass look more important — or less important — than it really is?

Attendance

Discussion

  • Today’s plan
  • Chart audit
  • Guided walkthrough
  • Your figures

💬 What story do your figures tell?

  • Wrap-up

Show and tell

“What story do your figures tell?”

2–3 volunteers: share a figure. Class discusses:

  • What does this figure show clearly?
  • What’s missing?
  • How do your choices (axis ranges, colours, what’s included) affect the impression?

Wrap-up

  • Today’s plan
  • Chart audit
  • Guided walkthrough
  • Your figures
  • Discussion

Any questions we missed?

Submit questions:

PollEv.com/geol

text geol to 07480 781235

Commit your work

Save your code to week2.R. Commit and push.

Your repo now has two weeks of work:

  • week1.R — exploratory code
  • week2.R — figures

Next week: “How confident should we be?”

We’ll ask whether the biomass numbers really add up.