Changing the assumptions

Research Skills — Week 3 Application

Today’s plan

  • Guided walkthrough
  • Your scenario analysis
  • Discussion
  • Start your briefing
  • Wrap-up

Goals

In the content session, you audited the assumptions behind biomass carbon accounting.

Now: test what happens when you change them.

  1. Add transport emissions
  2. Add supply chain emissions
  3. Change the forest regrowth timeline
  4. See how wide the range gets

Questions?

Submit questions:

PollEv.com/geol

text geol to 07480 781235

Guided walkthrough

  • Today’s plan

🎓💻 Scenario analysis in R

  • Your scenario analysis
  • Discussion
  • Start your briefing
  • Wrap-up

Starting point: the “official” view

Biomass emission factor at combustion: 0 gCO₂/kWh

(That’s the carbon accounting rule.)

But what if we add the costs the rule ignores?

Adding transport

How much does transport add?

Adding the payback period

Trees absorb CO₂ as they grow. But how long does regrowth take?

  • Fast regrowth (10 years): biomass is roughly carbon-neutral over the short term
  • Slow regrowth (40+ years): biomass has a carbon debt for decades
  • Net zero target: 2050 — only ~20 years away

If the payback exceeds the policy horizon, biomass is not carbon-neutral when it matters.

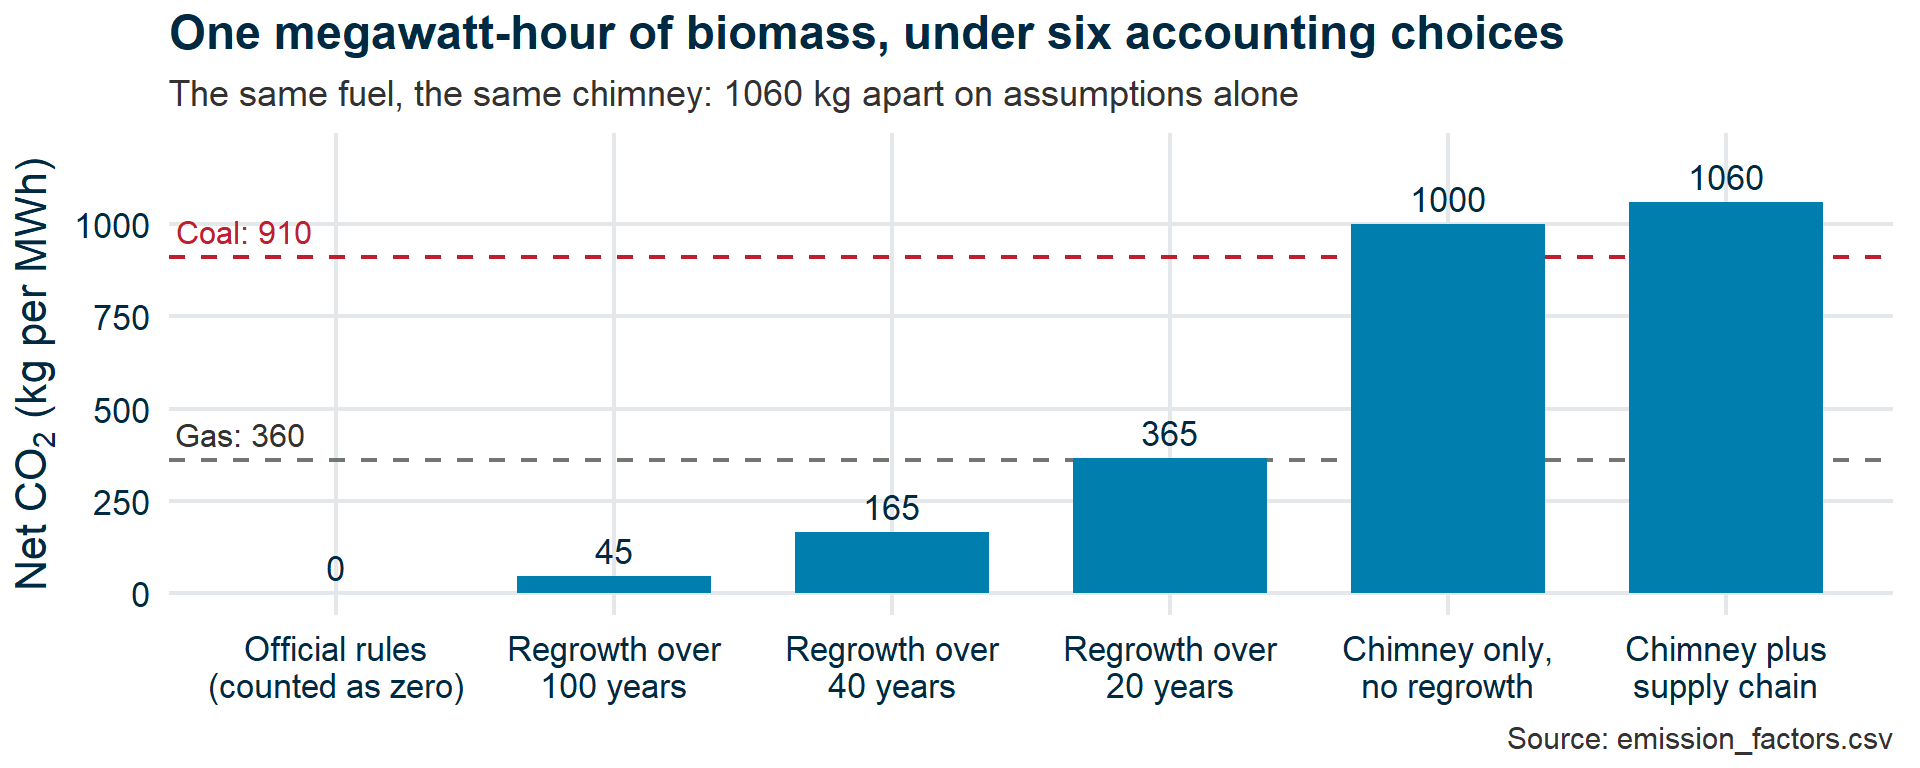
The same fuel, six answers

Bar chart of net CO2 per MWh of biomass under six accounting choices, rising from zero under official rules through 45, 165 and 365 for 100-, 40- and 20-year regrowth to 1000 for the chimney alone and 1060 including the supply chain. Dashed reference lines mark gas at 360 and coal at 910; the two tallest bars rise above the coal line.

Your scenario analysis

  • Today’s plan
  • Guided walkthrough

✏️💻 Independent exercises

  • Discussion
  • Start your briefing
  • Wrap-up

Exercises

The WebR page has four scaffolded exercises:

  1. Transport scenario — estimate CO₂ cost of shipping pellets
  2. Supply chain scenario — add harvesting, processing, drying
  3. Payback scenario — plot cumulative emissions under different regrowth timelines
  4. Extension: Best case and worst case — combine all assumptions

How wide is the range? What does that tell you about certainty?

Attendance

Discussion

  • Today’s plan
  • Guided walkthrough
  • Your scenario analysis

💬 What did you find?

  • Start your briefing
  • Wrap-up

Key messages

  • The answer depends on which costs you include
  • The timescale matters — carbon-neutral over centuries, but not over decades
  • The “official” answer (zero) is a policy choice, not a scientific measurement

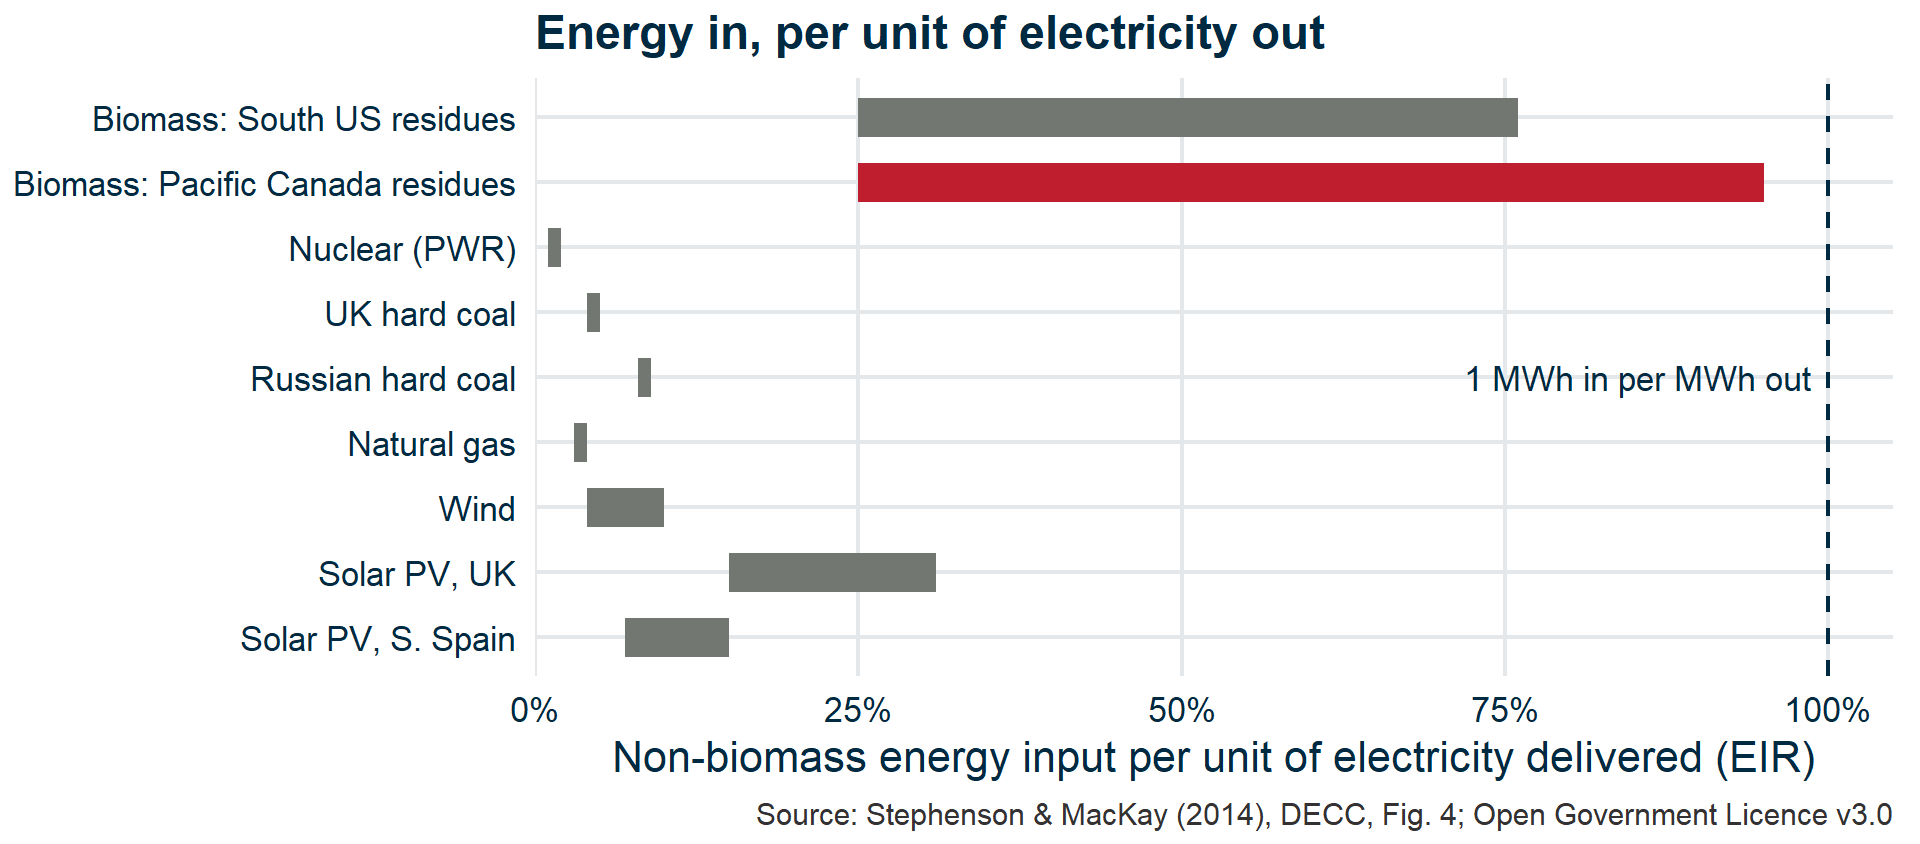
And it’s even worse than that

Range bars of non-biomass energy input per unit of electricity delivered. Nuclear, coal and gas sit below 10 percent, wind at 4 to 10, solar at 7 to 31. Biomass from South US residues spans 25 to 76 percent; biomass from Pacific Canadian residues, highlighted in red, spans 25 to 95 percent, almost reaching a dashed line at 100 percent.

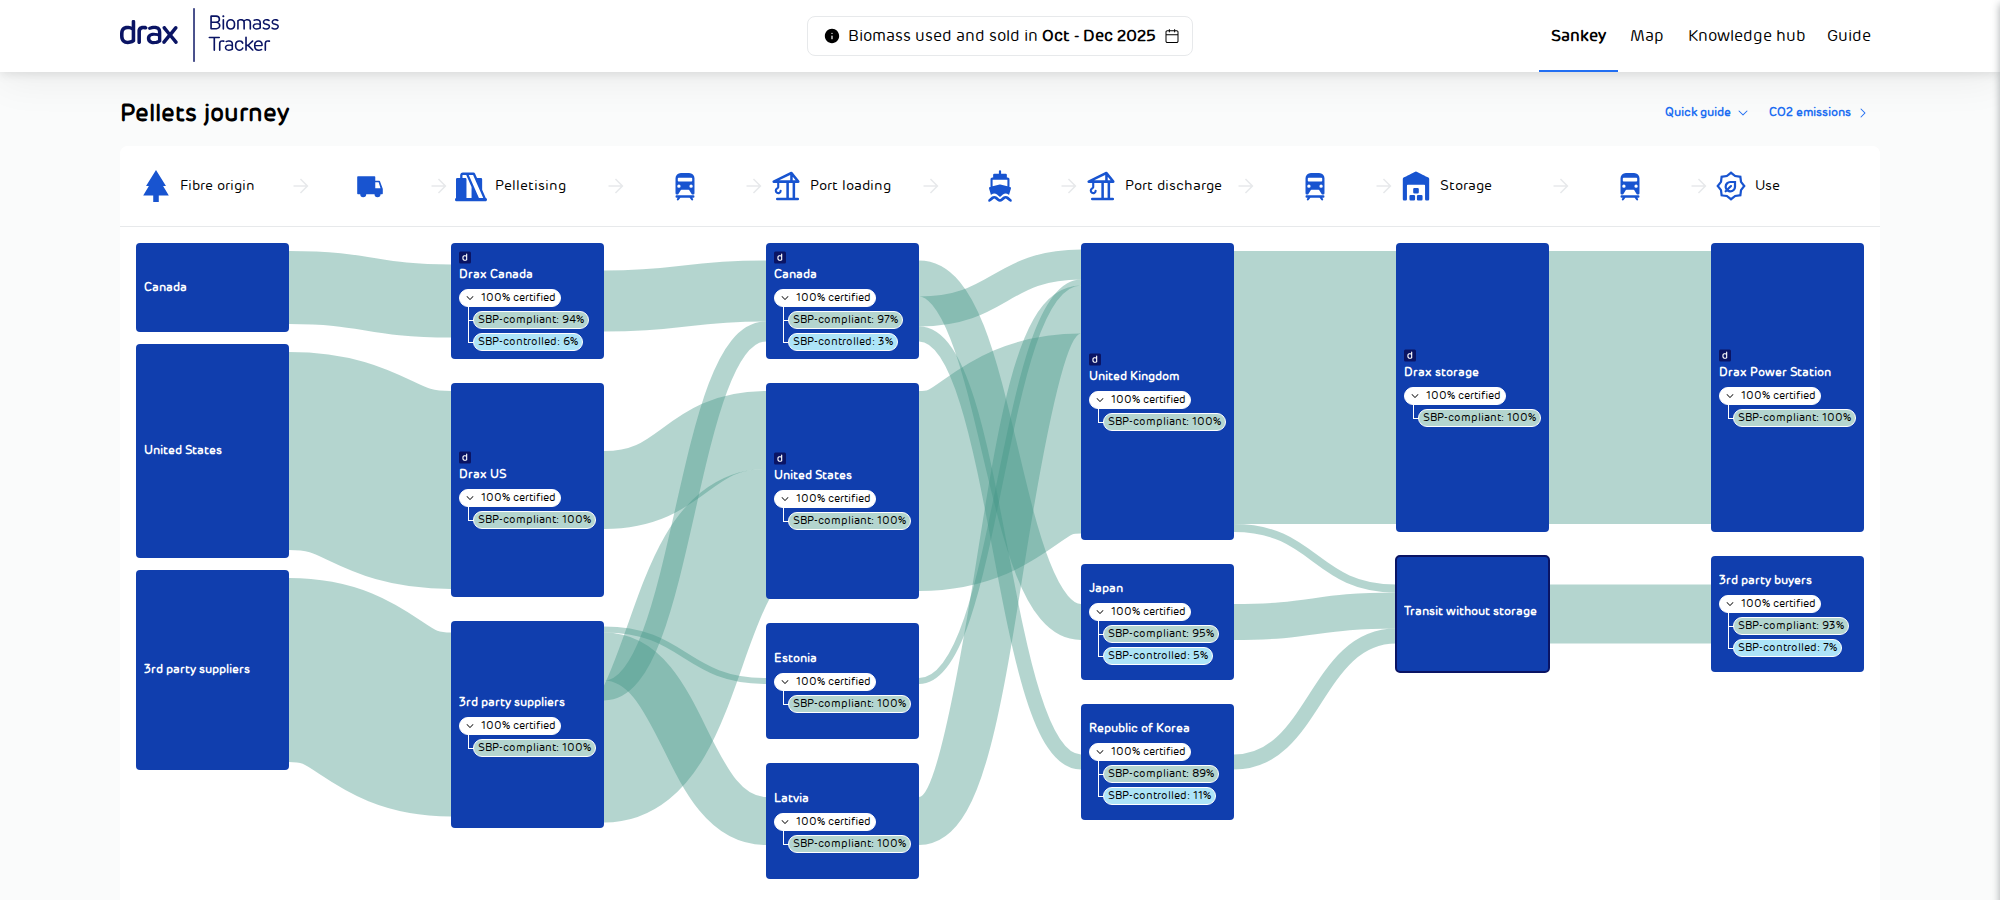
Drax’s own numbers

Screenshot of the Drax Biomass Tracker for October to December 2025: a Sankey diagram tracing pellets from fibre origin (Canada, United States, third-party suppliers) through pelletizing, loading ports, discharge ports (UK, Japan, Korea) and storage to Drax Power Station and third-party buyers, with certification badges on every node.

Drax Biomass Tracker, Oct–Dec 2025. © Drax Group plc

Whose pellets?
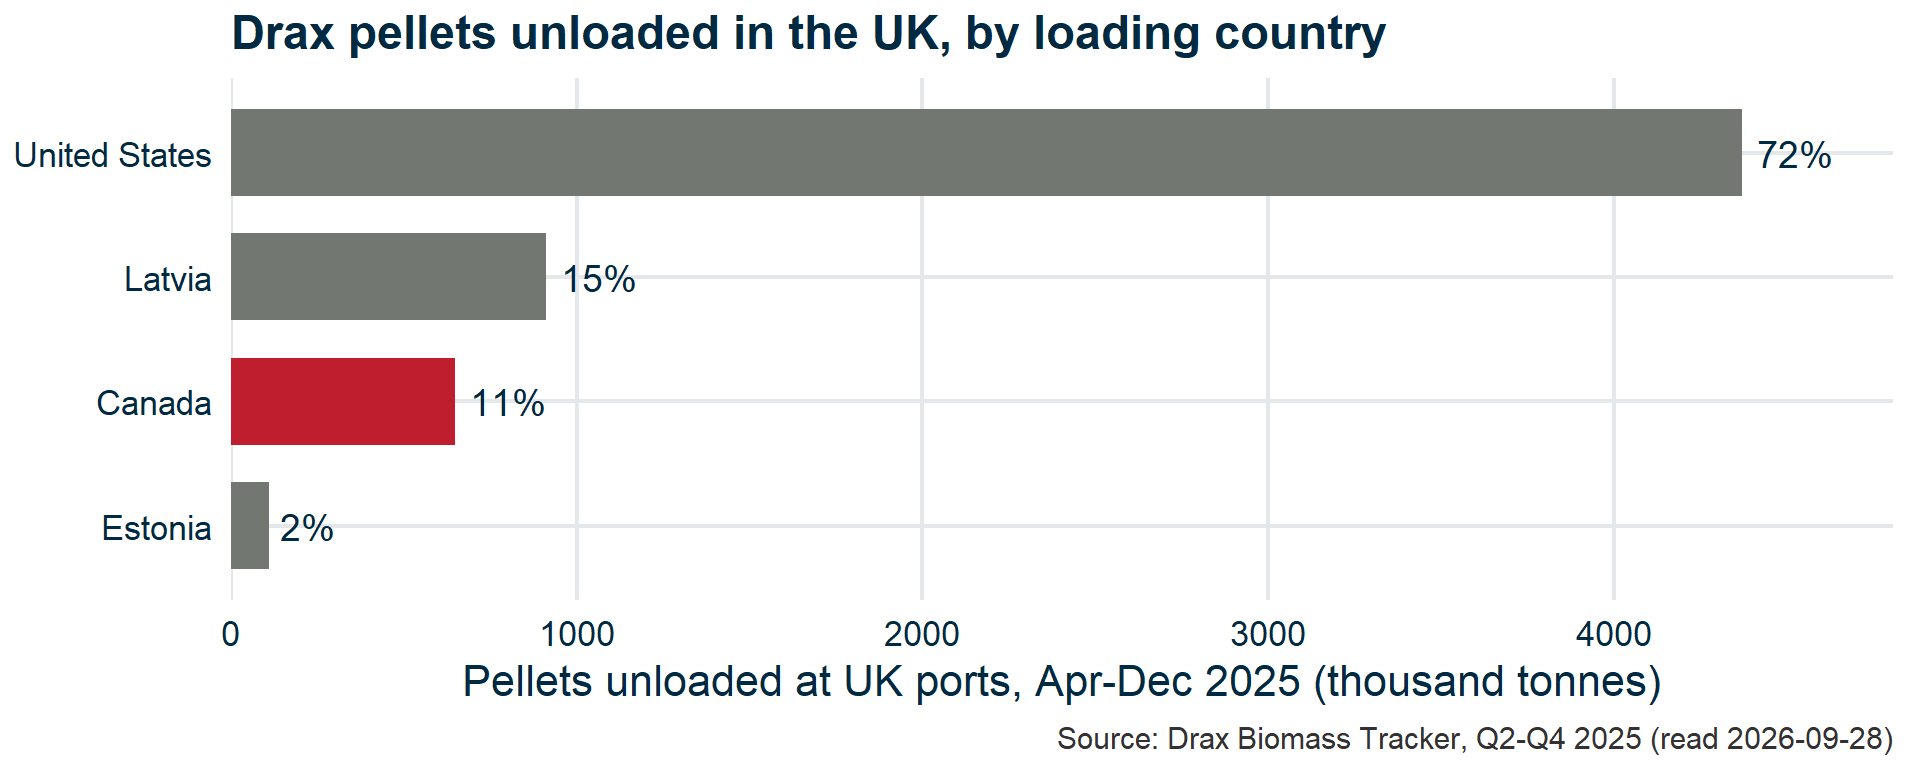
Bar chart of pellets unloaded at UK ports from April to December 2025 by loading country: United States 72 percent, Latvia 15 percent, Canada 11 percent (highlighted in red), Estonia 2 percent.

The ethical question

“If you were writing a policy briefing, which scenario would you present? Why?”

Cast your vote

PollEv.com/geol

text geol to 07480 781235

Think about this. You’ll be writing that briefing next week.

Start your briefing

  • Today’s plan
  • Guided walkthrough
  • Your scenario analysis
  • Discussion

✏️ 15 minutes

  • Wrap-up

Save a figure

Pick the figure that best makes your case.

  1. Right-click it → Save image as…
  2. Save it in your repo, in a folder called figures
  3. Commit and push it in GitHub Desktop

Markdown in one table

You type You get
# Title The title
## Section A section heading
**bold** bold
*italic* italic
- item A bulleted list
![alt text](figures/name.png) The figure
A blank line A new paragraph

Create briefing.md

On github.com: Add file → Create new file → briefing.md

Paste the skeleton from the exercise page, fix the figure path, then click Preview.

Commit, then Fetch and Pull in GitHub Desktop.

Wrap-up

  • Today’s plan
  • Guided walkthrough
  • Your scenario analysis
  • Discussion
  • Start your briefing

Any questions we missed?

Submit questions:

PollEv.com/geol

text geol to 07480 781235

Commit your work

Save your code to week3.R. Commit and push.

Check that briefing.md and your figure show on github.com.

Next week is the big one:

You’ll write your policy briefing and review each other’s work.

“What assumptions are we making?”

The question that determines the answer.