How confident should we be?
Research Skills — Week 3
Questions?

Submit questions:
PollEv.com/geol
text geol to 07480 781235
Precision vs accuracy
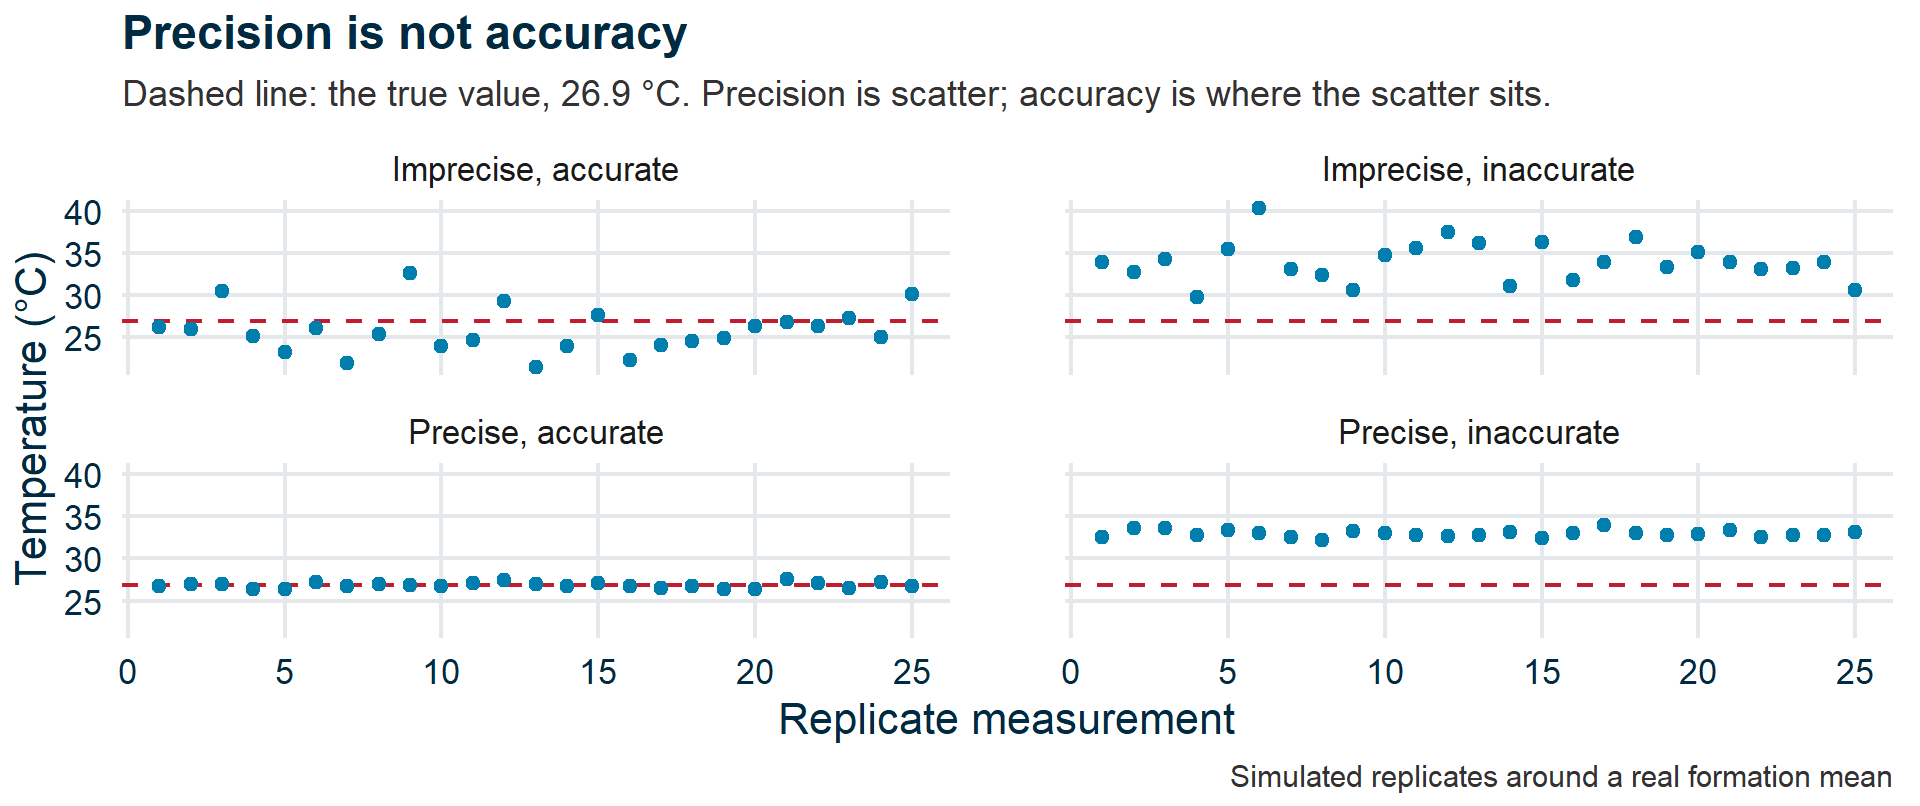
Precise but inaccurate
Measurements cluster tightly — but around the wrong value.
e.g., a miscalibrated thermometer
Accurate but imprecise
Measurements centre on the right value — but scatter widely.
e.g., noisy field readings

Always on target, or always into your own goal?
Dominic Nelson, CC BY-SA 4.0
Which is worse? It depends on whether you can correct the bias.
All four combinations
The coal emission factor
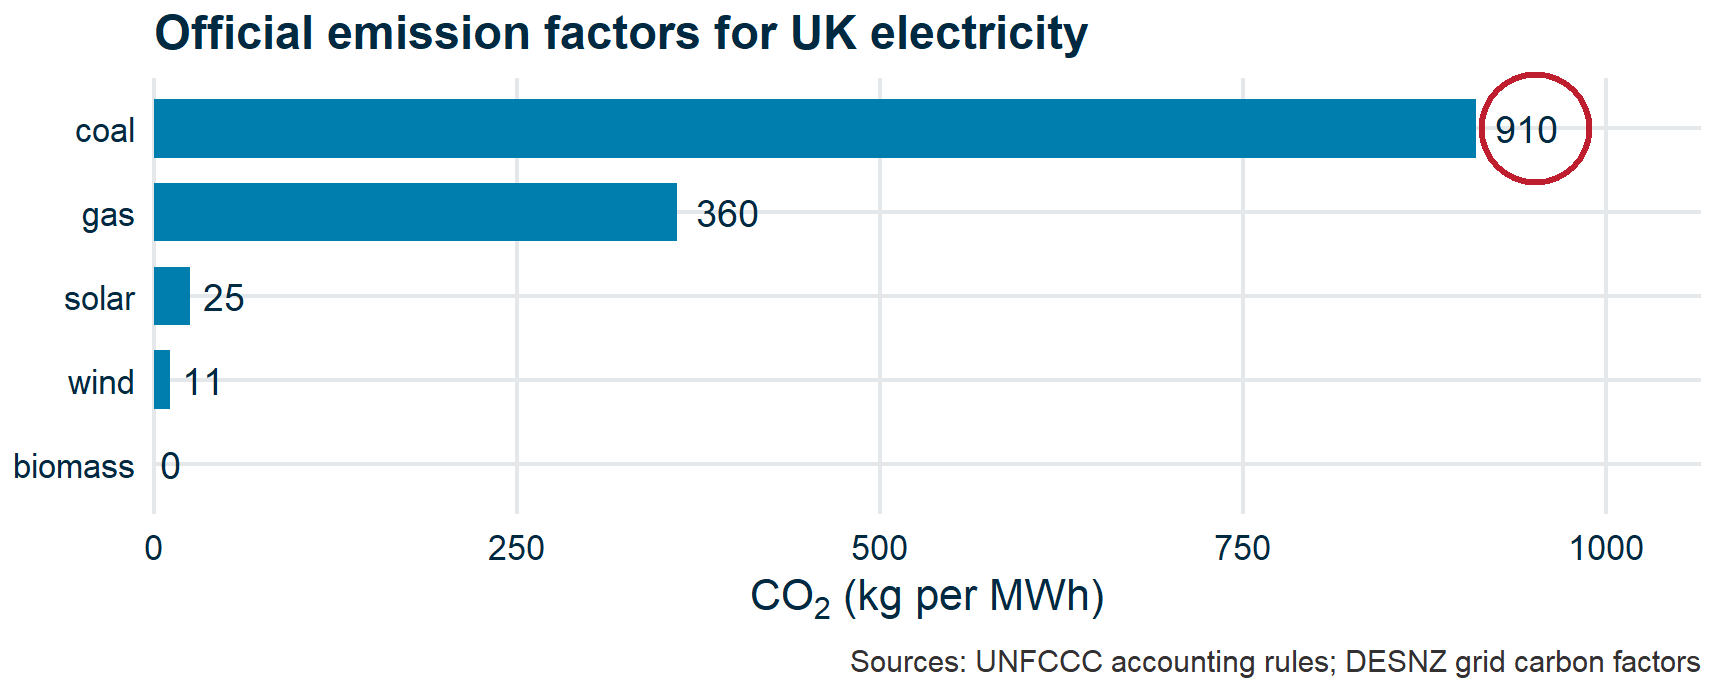
“What are the sources of uncertainty in this number?”
Discuss as a desk. 5 minutes. Then share.
The courtroom analogy
In a trial
- Start with “innocent”
- Look at the evidence
- Decide: enough to convict?
In statistics
- Start with “no effect” (null hypothesis)
- Look at the data
- Decide: enough to reject the null?
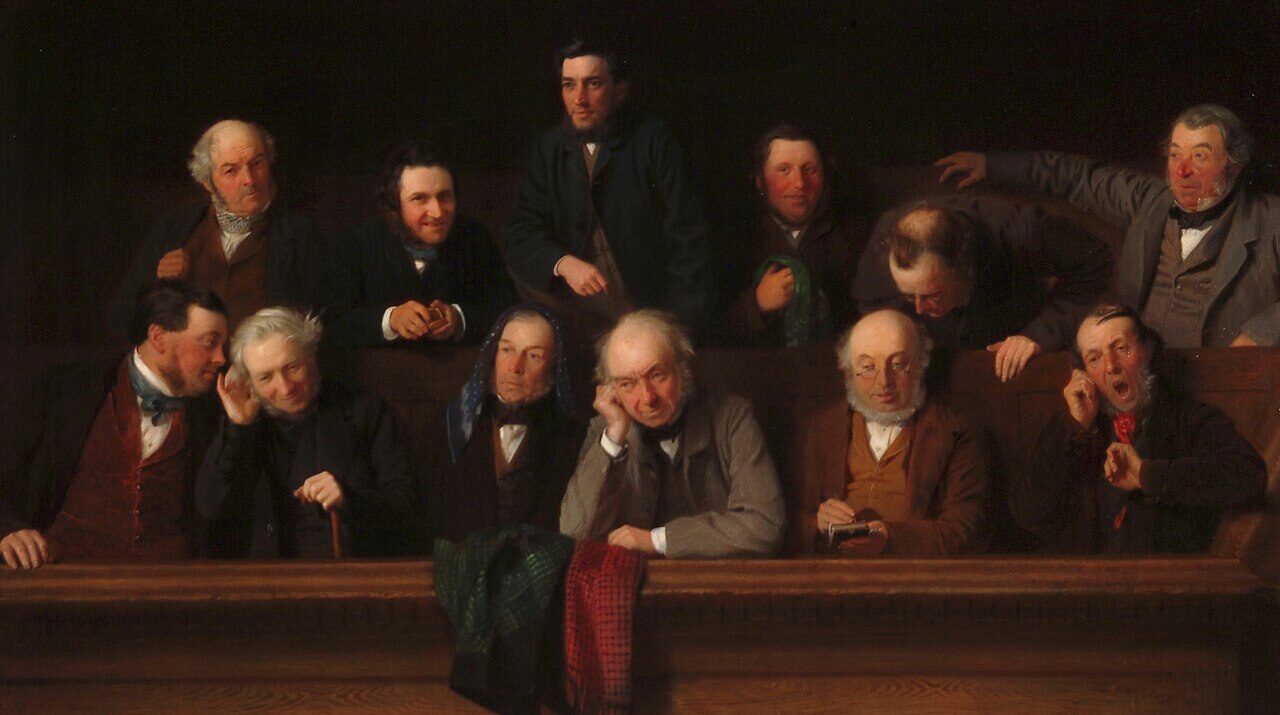
The Jury (1861), John Morgan — Buckinghamshire County Museum, public domain
What does “overlap” look like?
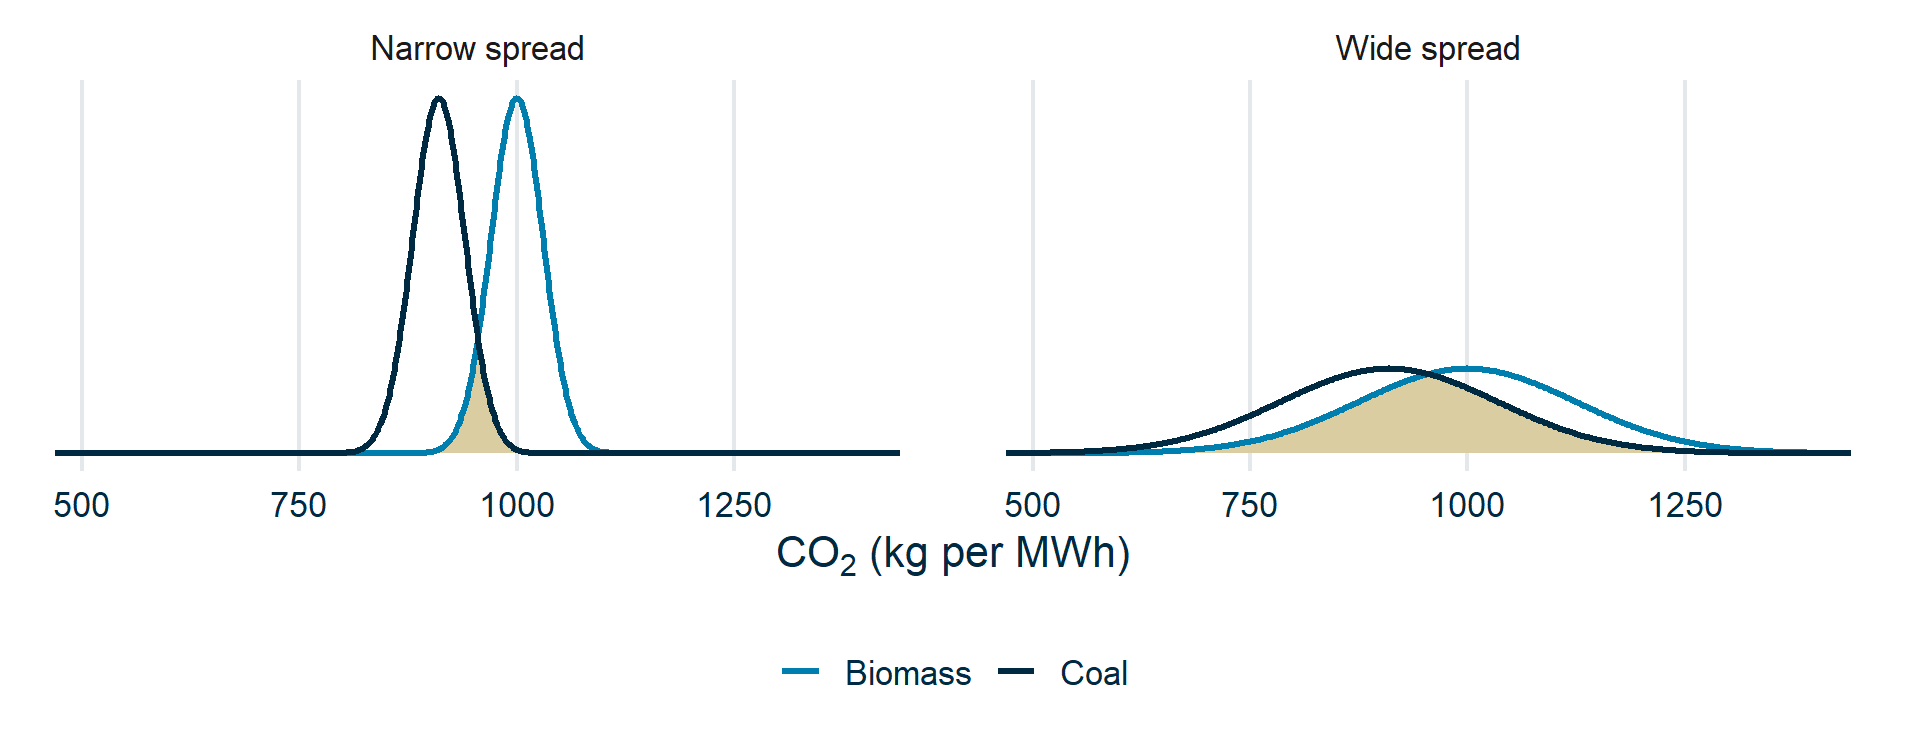
At-chimney emissions: CO₂ measured as it leaves the plant. Same means in each panel (Coal: 910; Biomass: 1000 kg CO₂/MWh).
The question: is this difference bigger than we’d expect by chance?
Population vs sample
You have data from Drax — one power station.
Can you generalize to “biomass electricity”?
Drax produces ~86% of UK biomass electricity. Does that help or hurt?
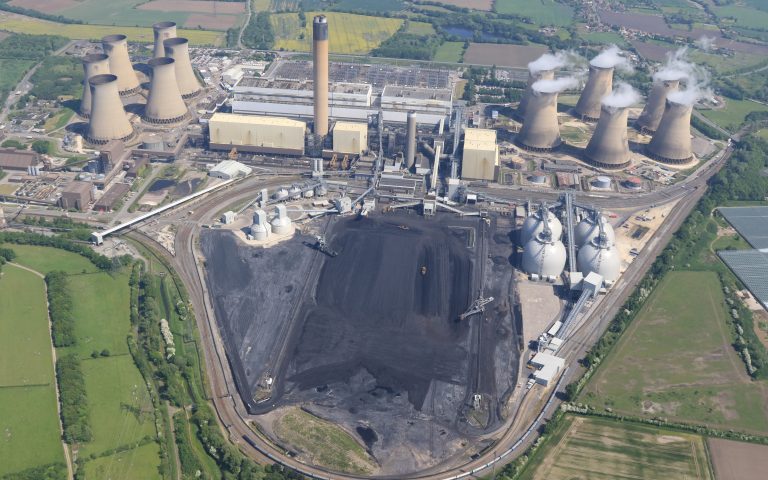
One power station, standing in for a whole fuel. © Drax
Selection bias
If you only measure the biggest, best-known facility, your results may not generalize.
Survivorship bias: if failing biomass plants shut down and disappear from the data, the remaining ones look better than average.
Confounding: biomass plants might be newer than coal plants. Any efficiency difference might reflect age, not fuel.
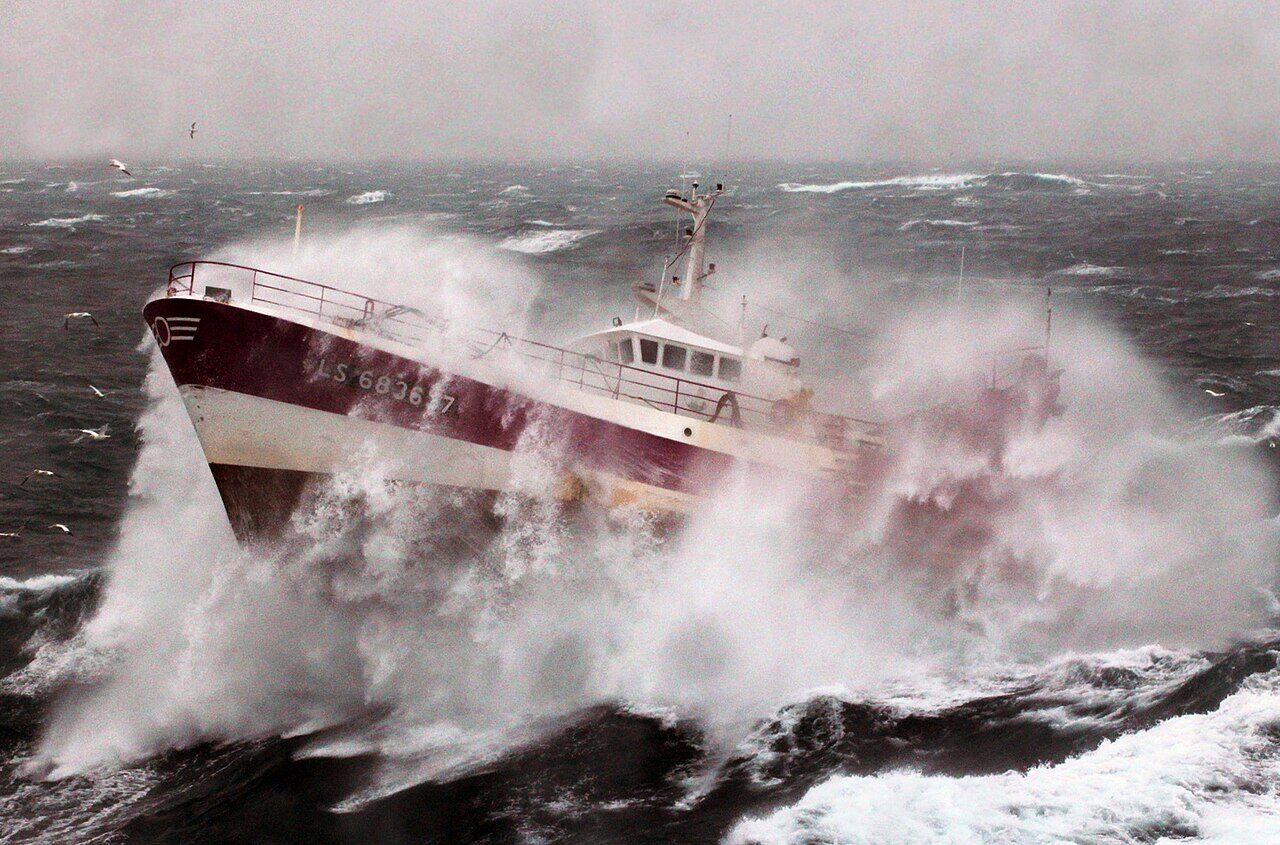
Every boat in the harbour survived the storm.
Royal Navy / MOD, OGL v1.0
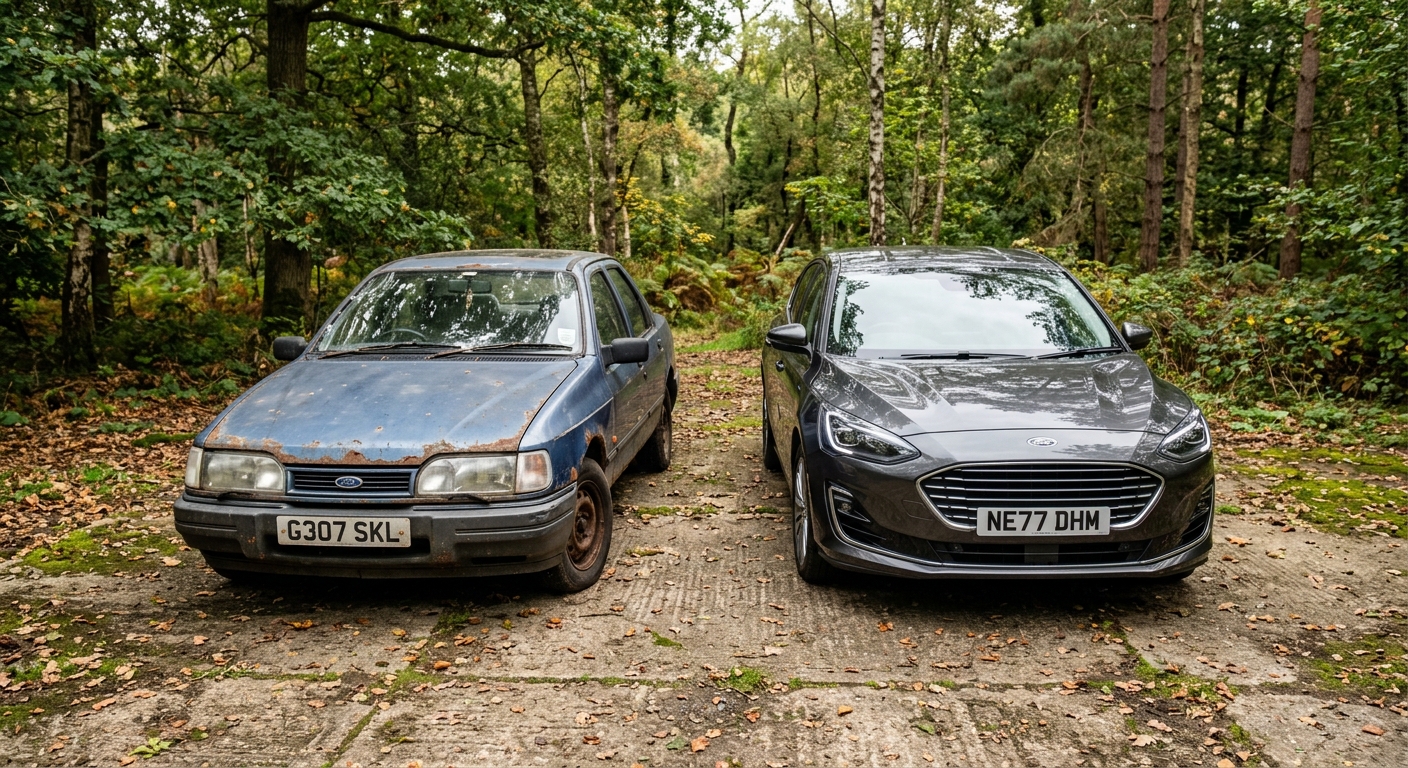
Older, or worse built? The fuel is not the only thing that differs.
AI-generated (Gemini/Nano Banana 2)
Exit ticket
A lifecycle assessment reports that UK biomass electricity produces 0 gCO₂/kWh. What is the most important thing to check before accepting this number?
PollEv.com/geol
text geol to 07480 781235
Any questions we missed?
Submit questions:
PollEv.com/geol
text geol to 07480 781235