Making the case

Research Skills — Week 4

Recap

  • Writing for a policy audience
  • Write a summary
  • How to lie with statistics
  • “What’s missing?”
  • Effective figures for a briefing
  • The briefing assignment
  • Wrap-up

The journey so far

  • Week 1: Does biomass help reach net zero? (Curiosity)
  • Week 2: The numbers are interesting (Discovery)
  • Week 3: The answer depends on the assumptions (Doubt)

Week 4: Write it up. Make the case. And learn to spot when someone else isn’t making it honestly.

Questions?

Submit questions:

PollEv.com/geol

text geol to 07480 781235

Writing for a policy audience

  • Recap

🎓 Concept block 1

  • Write a summary
  • How to lie with statistics
  • “What’s missing?”
  • Effective figures for a briefing
  • The briefing assignment
  • Wrap-up

Who is your reader?

A policy-maker: busy, not a specialist, needs to make a decision.

What they need:

  • A clear bottom line
  • Evidence they can trust
  • Honest acknowledgement of uncertainty

Structure of a policy briefing

Section Purpose
Summary The answer — first. Reader could stop here.
Evidence Figures, data, analysis
Caveats What’s uncertain, what depends on assumptions
Conclusions Recommendation, with caveats attached

Compare to an academic paper: background first, answer last.

A briefing is the opposite — answer first, evidence after.

A real parliamentary briefing

Governance of solar radiation modification research — POSTnote 773, Parliamentary Office of Science and Technology, 13 July 2026.

https://post.parliament.uk/research-briefings/post-pn-0773/ · DOI 10.58248/PN773

POST’s sections Our structure
Overview and key points Summary — the answer, first
How the research is conducted; funding figures Evidence
Geopolitics; ethics and legislation Caveats
What has been tried already Conclusions

The summary test

If your reader stops after the first paragraph, do they know:

  1. What you investigated?
  2. What you found?
  3. What you recommend?

Write a summary

  • Recap
  • Writing for a policy audience

💬✏️ Exercise 1

  • How to lie with statistics
  • “What’s missing?”
  • Effective figures for a briefing
  • The briefing assignment
  • Wrap-up

10 minutes

Write a 3–4 sentence summary of your biomass findings, aimed at a government minister.

Then we’ll share a few.

Is the message clear? Is the uncertainty honest? Would a minister know what to do?

How to lie with statistics

  • Recap
  • Writing for a policy audience
  • Write a summary

🎓 Concept block 2

  • “What’s missing?”
  • Effective figures for a briefing
  • The briefing assignment
  • Wrap-up

Same data – two conclusions

Two reports present the same data in different ways.

Both are technically accurate.

One is honest. The other is not.

As a desk, annotate: - What does each report do well? - Where is it dishonest?

Links: Pro-AI | Anti-AI

Two exemplar reports

Faithful report

Balanced evidence. Honest caveats. Uncertain where the data are uncertain.

Traitor report

Selective evidence. Misleading framing. Confident where it shouldn’t be.

Ardross Castle in the Scottish Highlands, a baronial mansion with turrets, seen from its lawn on a bright day.

Ardross Castle, where The Traitors is filmed.
Derek Spence / Geograph, CC BY-SA 2.0

Let’s look at the techniques.

Technique 1: Cherry-picking

Choose the number that tells your story.

Example: AI energy per query — 0.3 Wh (a Google search) vs 18.9 Wh (a complex AI task). Same topic, 60× difference, depending on which you cite.

Technique 2: Invalid chart type

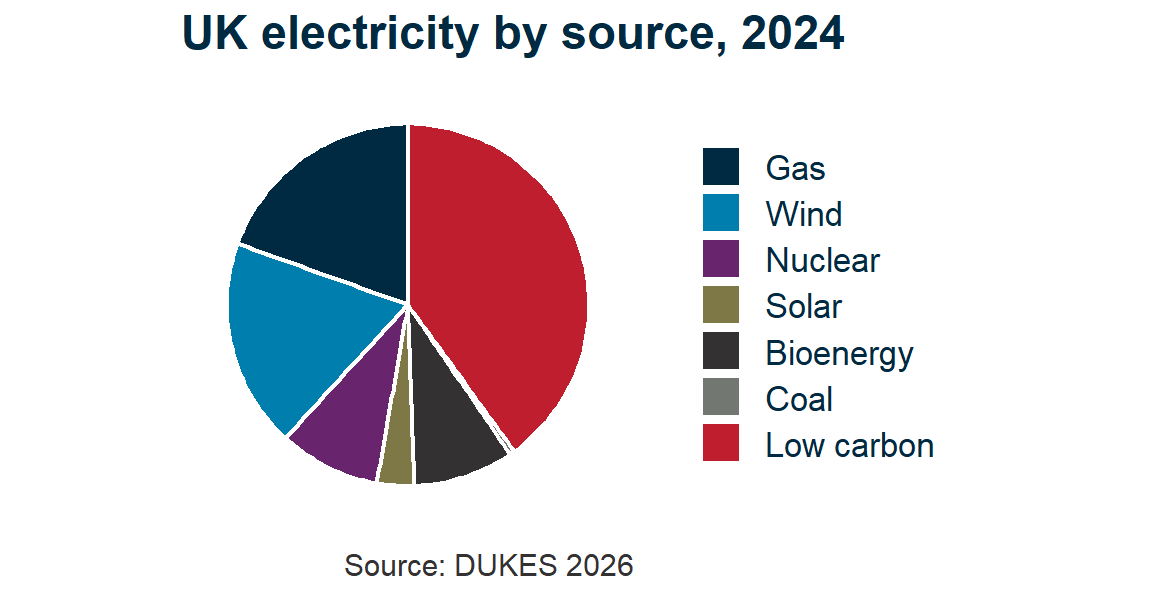
A pie chart of things that don’t form a whole.

A pie chart of UK generation by fuel in which the slices sum to more than the whole, because one category is counted twice.

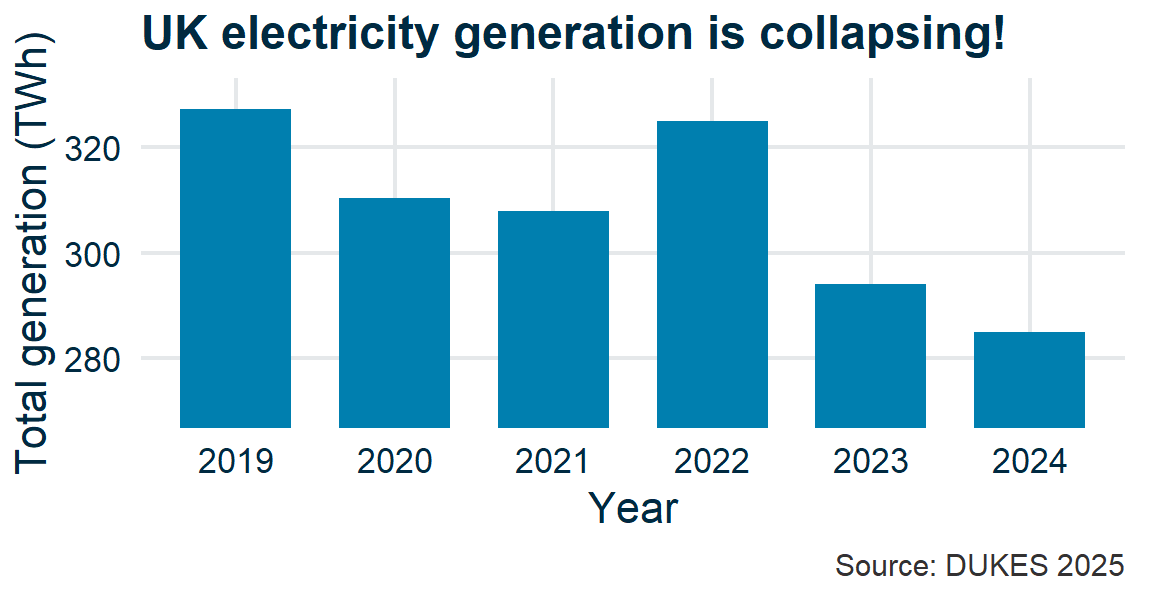
Or a bar chart where the y-axis doesn’t start at zero.

Bar chart of UK total generation from 2019 to 2024 with the y-axis starting at 270 TWh, so a 13% fall looks like a collapse.

The chart is “technically correct” but visually lies.

Technique 3: Cross-scale conflation

Compare a small thing to a big thing without adjusting the scale.

Example: “Global AI uses less electricity than UK households.”

Both are true numbers — but the comparison is meaningless without matching the scales (global vs national).

Technique 4: Omission

What you don’t show matters as much as what you do.

Example: Omit the supply chain, the payback period, or the alternative scenario. The remaining evidence looks cleaner — and more convincing.

The lesson

The most dangerous misinformation is technically sourced.

You can’t just fact-check the numbers — you have to audit the choices.

“What’s missing?”

  • Recap
  • Writing for a policy audience
  • Write a summary
  • How to lie with statistics

💬 Exercise 2

  • Effective figures for a briefing
  • The briefing assignment
  • Wrap-up

Spot the omission

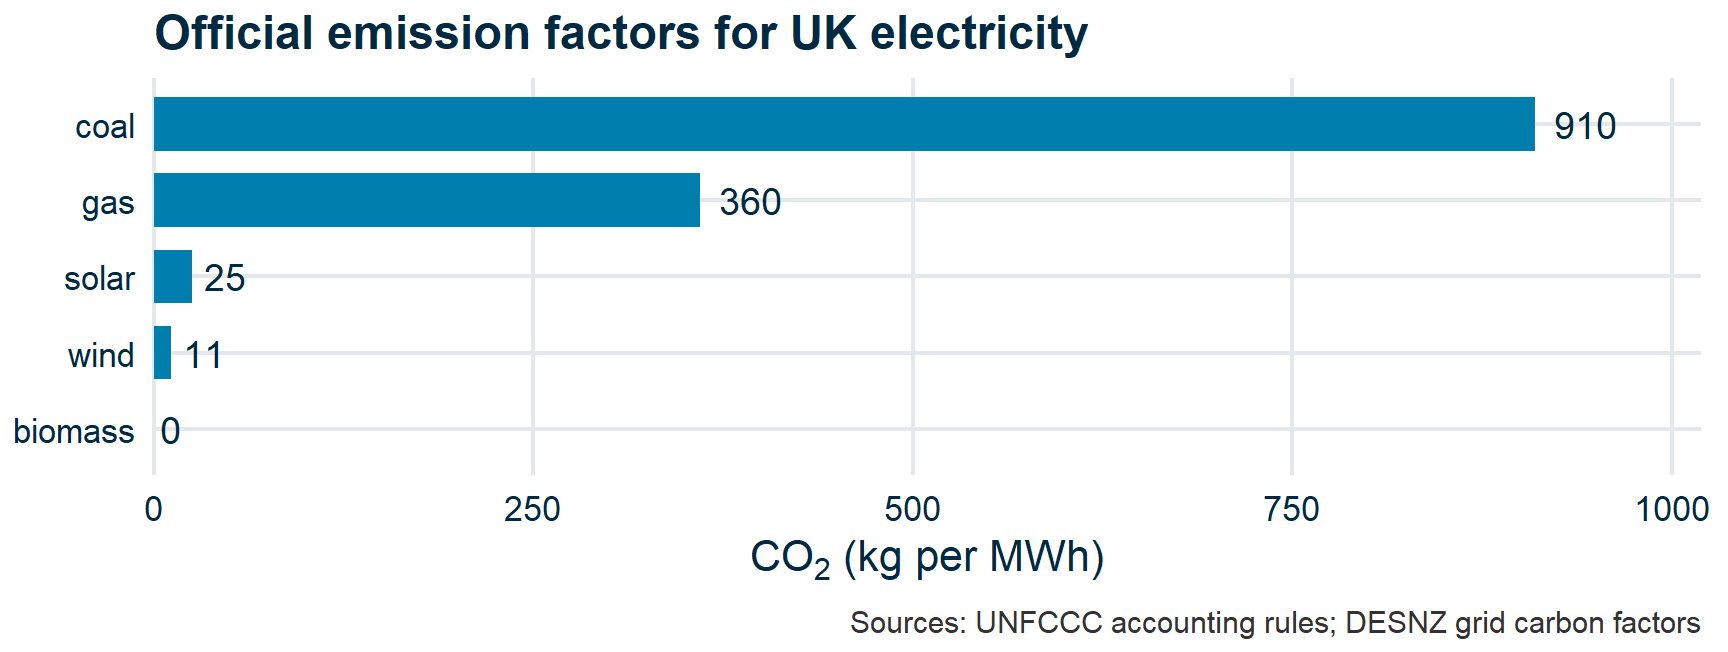
Bar chart of official CO2 emission factors: coal 910, gas 360, solar 25, wind 11, biomass zero. Nothing on the chart indicates that the biomass figure excludes the supply chain and assumes regrowth.

What’s been left out? How does the omission change the impression?

Attendance

Effective figures for a briefing

  • Recap
  • Writing for a policy audience
  • Write a summary
  • How to lie with statistics
  • “What’s missing?”

🎓 Concept block 3

  • The briefing assignment
  • Wrap-up

Principles (revisited)

  1. Every figure needs a “so what” — what should the reader take from it?
  2. Don’t show everything. Show the thing that matters.
  3. Captions tell the story, not just the axes.
  4. Label directly rather than relying on legends.

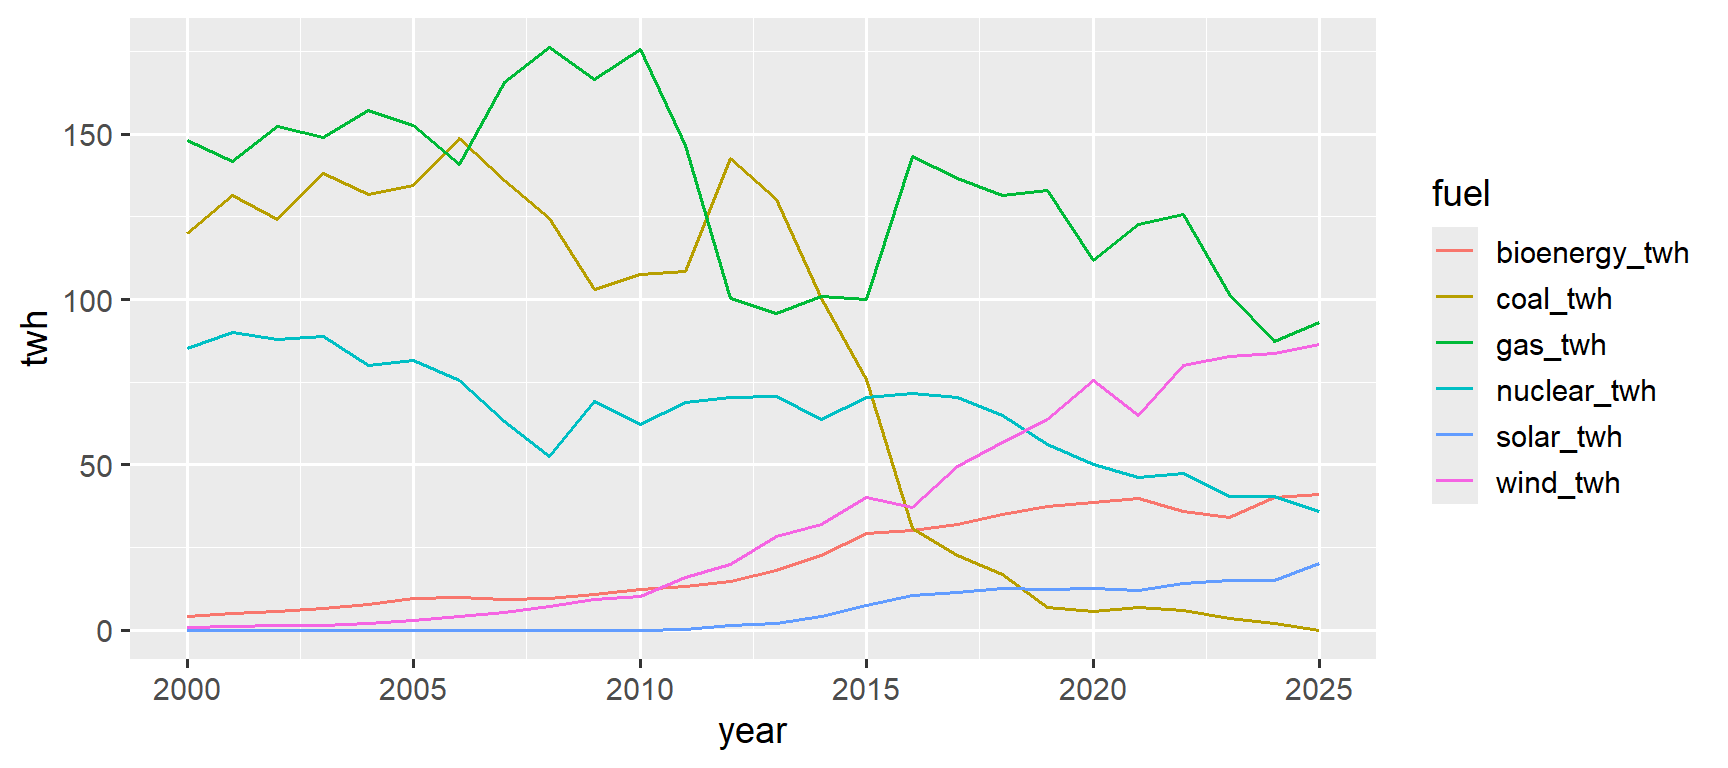
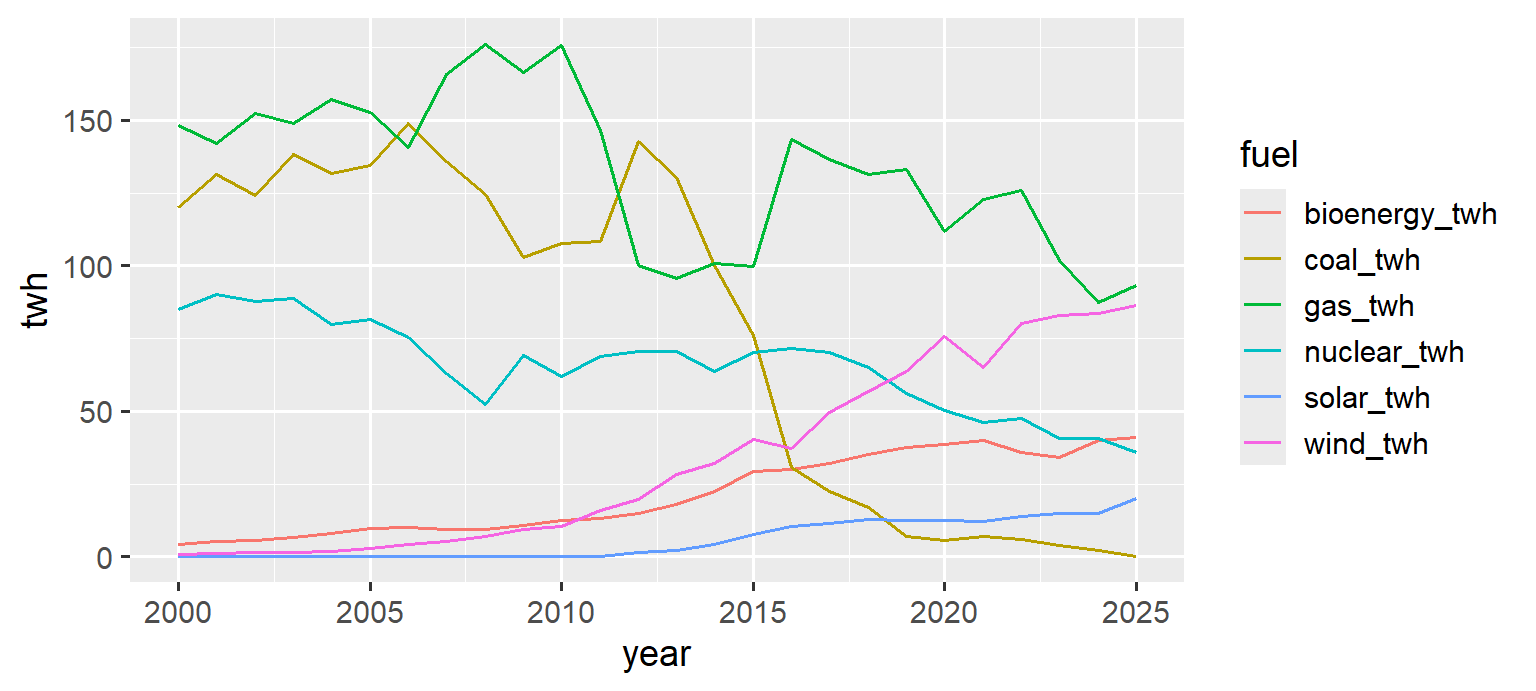
Before

Six thin lines of UK generation by fuel on a grey panel. The legend is alphabetical by column name — bioenergy_twh, coal_twh and so on — the y-axis is labelled twh, and there is no caption.

1 So what? 2 Show what matters 3 Captions tell the story 4 Label directly

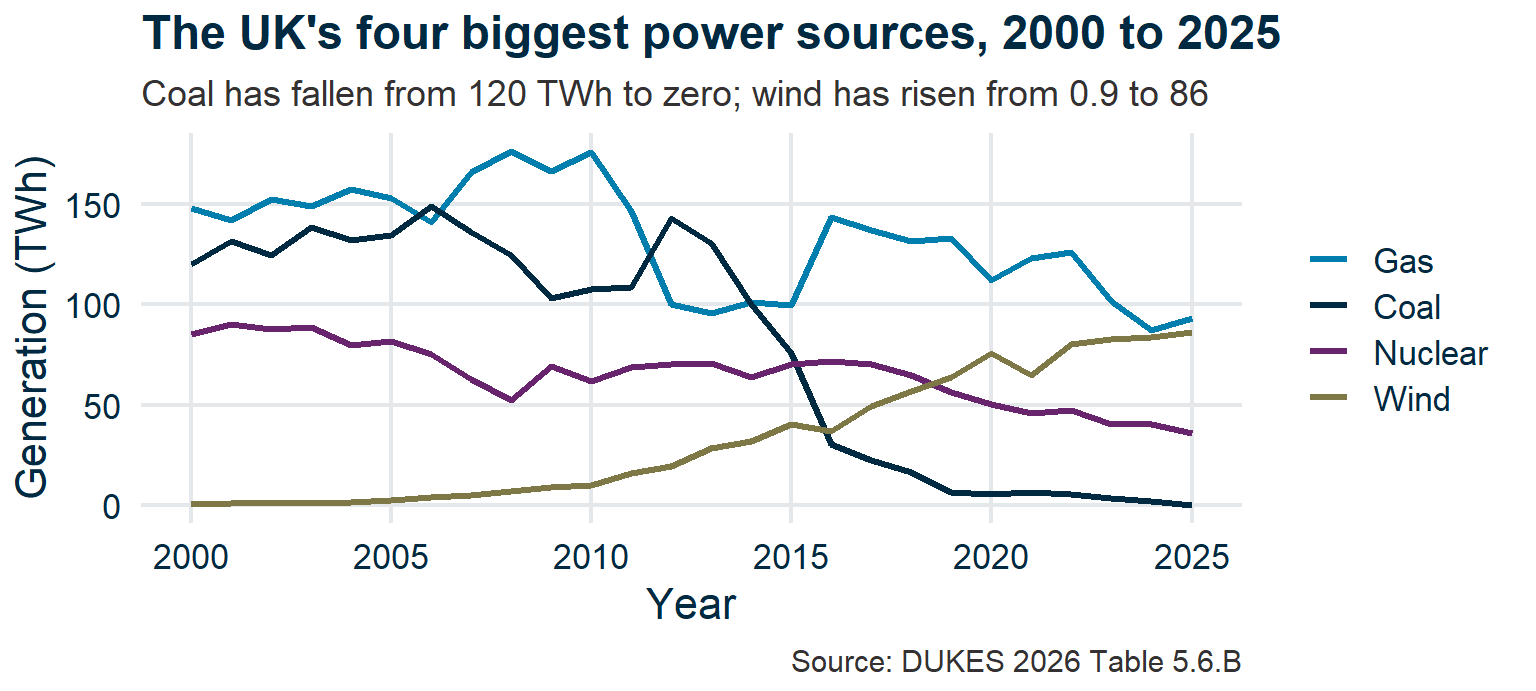
After
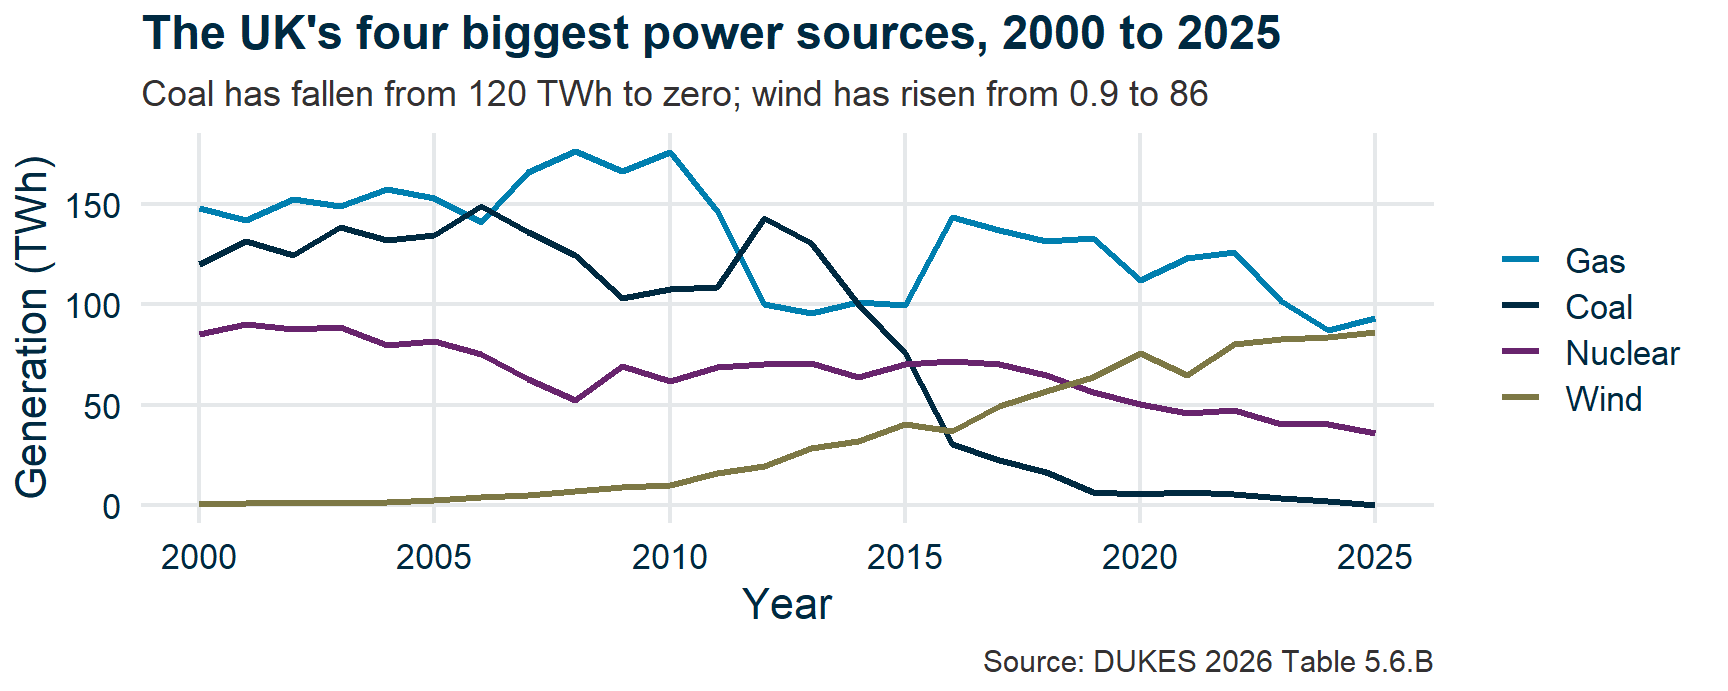
Four thick lines on white — gas, coal, nuclear and wind — with coal and wind crossing around 2015. Axes named with units, a title naming the period, and a subtitle saying coal has fallen from 120 TWh to zero while wind has risen from 0.9 to 86.

1 So what? 2 Show what matters 3 Captions tell the story 4 Label directly

Before and after

Before After

The same six-line grey-panel chart as before, shown small for comparison.

The same four-line white-panel chart as before, shown small for comparison.

Same data, same file. What changed — and which change did the most work?

Series All six fuels The four largest by mean over 2000–2025
Legend order Alphabetical by column name — nothing to do with size Largest mean first
Y axis twh Generation (TWh)
Words None A subtitle saying what to look at; a named source
Panel Default grey White, faint gridlines

The briefing assignment

  • Recap
  • Writing for a policy audience
  • Write a summary
  • How to lie with statistics
  • “What’s missing?”
  • Effective figures for a briefing

📋🎓 Assignment and traitors

  • Wrap-up

Your assignment

Write a ~2-page policy briefing answering:

“Does UK biomass power help reach net zero, and should we keep paying for it?”

Due: committed to your GitHub repo by the end of the application session.

Structure: summary → evidence (with figures) → caveats → conclusions.

Peer review

You will each be assigned two classmates’ briefings.

One Issue per briefing — clarity, evidence, uncertainty, verdict.

The review form opens with two drop-downs a script reads:

Verdict   FAITHFUL / SUSPECT
Argues    KEEP-OR-EXPAND / KEEP-ONLY-WITH-CCS / PHASE-OUT

Two questions, not one

Do you believe it? — and, separately — what is it arguing?

A briefing can reach the conclusion you already hold and still be a traitor’s.

The traitors

Some of you will write deliberately misleading briefings.

You are not choosing. If you are a traitor, you have already been told — privately, and only you were told.

Everyone else: read carefully. Not everything is what it seems — including the things you agree with.

Wrap-up

  • Recap
  • Writing for a policy audience
  • Write a summary
  • How to lie with statistics
  • “What’s missing?”
  • Effective figures for a briefing
  • The briefing assignment

Any questions we missed?

Submit questions:

PollEv.com/geol

text geol to 07480 781235

Next time

Application session: “Write, review, reveal”

Three phases:

  1. Write your briefing (45 min)
  2. Review two others’ (30 min)
  3. The reveal (25 min)

Come ready to write. Your figures from Weeks 2–3 are your evidence.

The reveal is built from the reviews you file — so file them properly.