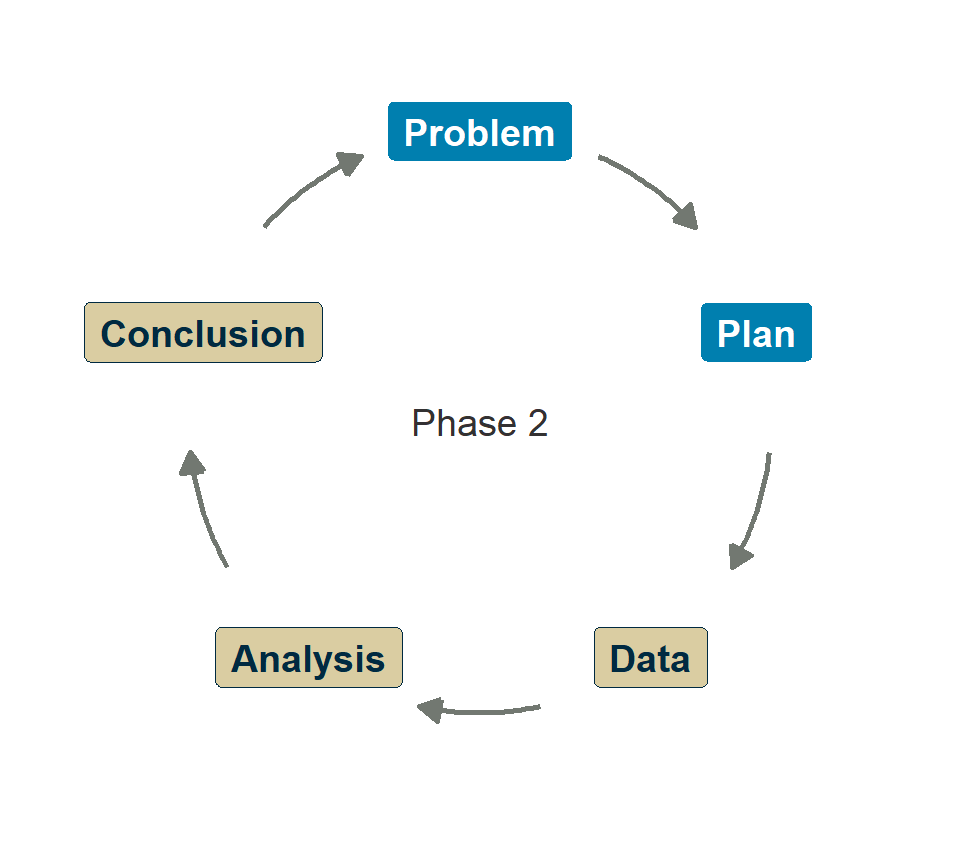
Designing an investigation

Research Skills — Week 5

Welcome to Phase 2

  • What makes a good experiment?
  • HolmesCo’s site investigation
  • Confounding variables
  • Spot the confounder
  • Sampling strategies
  • Design sketch
  • Wrap-up

The second phase

Phase 1 (done ✓)

Scaffolded formative mini-project.

Phase 2 (starts now)

Your own group’s question and dataset.

Summative — 30% of module grade.

Questions?

Submit questions:

PollEv.com/geol

text geol to 07480 781235

The assessment

Individual policy report (1,500–2,000 words).

  • Based on your group’s investigation
  • Same structure as Phase 1: summary → evidence → caveats → conclusions
  • Due after Week 10

Your commit history matters — it shows your individual contribution.

What makes a good experiment?

  • Welcome to Phase 2

🎓 Concept block 1

  • HolmesCo’s site investigation
  • Confounding variables
  • Spot the confounder
  • Sampling strategies
  • Design sketch
  • Wrap-up

The logic of comparison

You can’t know if something is big unless you measure something else.

Portrait of the economist and broadcaster Tim Harford.

Tim Harford: “Is that a big number?”
PopTech, CC BY-SA 2.0

Controls

What you hold constant so you can isolate the variable of interest.

Example: How does latitude affect wind farm output?

What confounding variables might we need to account for before we compare wind farms at different latitudes?

Control for Why
Turbine model Different models have different capacities
Terrain Ridgetop/valley/offshore: affects wind speed
Grid curtailment Grid operator tells certain farms to stop generating

What can’t you control? Weather. Maintenance schedules.

Treatment vs control groups

Lab sciences

Treatment group gets the intervention.

Control group doesn’t.

Random assignment.

Field sciences

“Treatment” is often a natural condition.

“Control” is a comparison group.

You can’t randomize geology.

HolmesCo’s site investigation

  • Welcome to Phase 2
  • What makes a good experiment?

💬✏️ Exercise 1

  • Confounding variables
  • Spot the confounder
  • Sampling strategies
  • Design sketch
  • Wrap-up

The scenario

“Geological Solutions Since 2019”

Ground Investigation Report Summary

Esh Spinning is a proposed twelve-turbine wind farm in County Durham.

We drilled 3 boreholes alongside access roads in the Deerness valley. All three encountered competent sandstone.

We conclude that bedrock across the site is suitable for turbine foundations.

How far do you trust the conclusion?

Work with the rest of your desk for 5 minutes.

Attendance

The problems

  • Tiny sample: 3 boreholes for a multi-km² site
  • Wrong location: boreholes in the valley, turbines on the ridgetops
  • Selection bias: sampled where it was convenient, not representative
  • No comparison: how do we know this is unusually good (or bad)?
  • Is this the right question? e.g. presence of mine workings?

Confounding variables

  • Welcome to Phase 2
  • What makes a good experiment?
  • HolmesCo’s site investigation

🎓 Concept block 2

  • Spot the confounder
  • Sampling strategies
  • Design sketch
  • Wrap-up

What is a confounder?

A variable that is correlated with both the treatment and the outcome.

You can’t tell which caused the effect.

Confounding examples

Observation Apparent cause Real cause (confounder)
Ice cream sales ↑, drowning ↑ Ice cream causes drowning? Hot weather
More solar panels → higher GDP Solar causes wealth? Latitude, governance, investment
Wind farms → fewer bird species Turbines harm birds? ???

Confounders, contra causation, can cause correlation.

Wind farms and birds

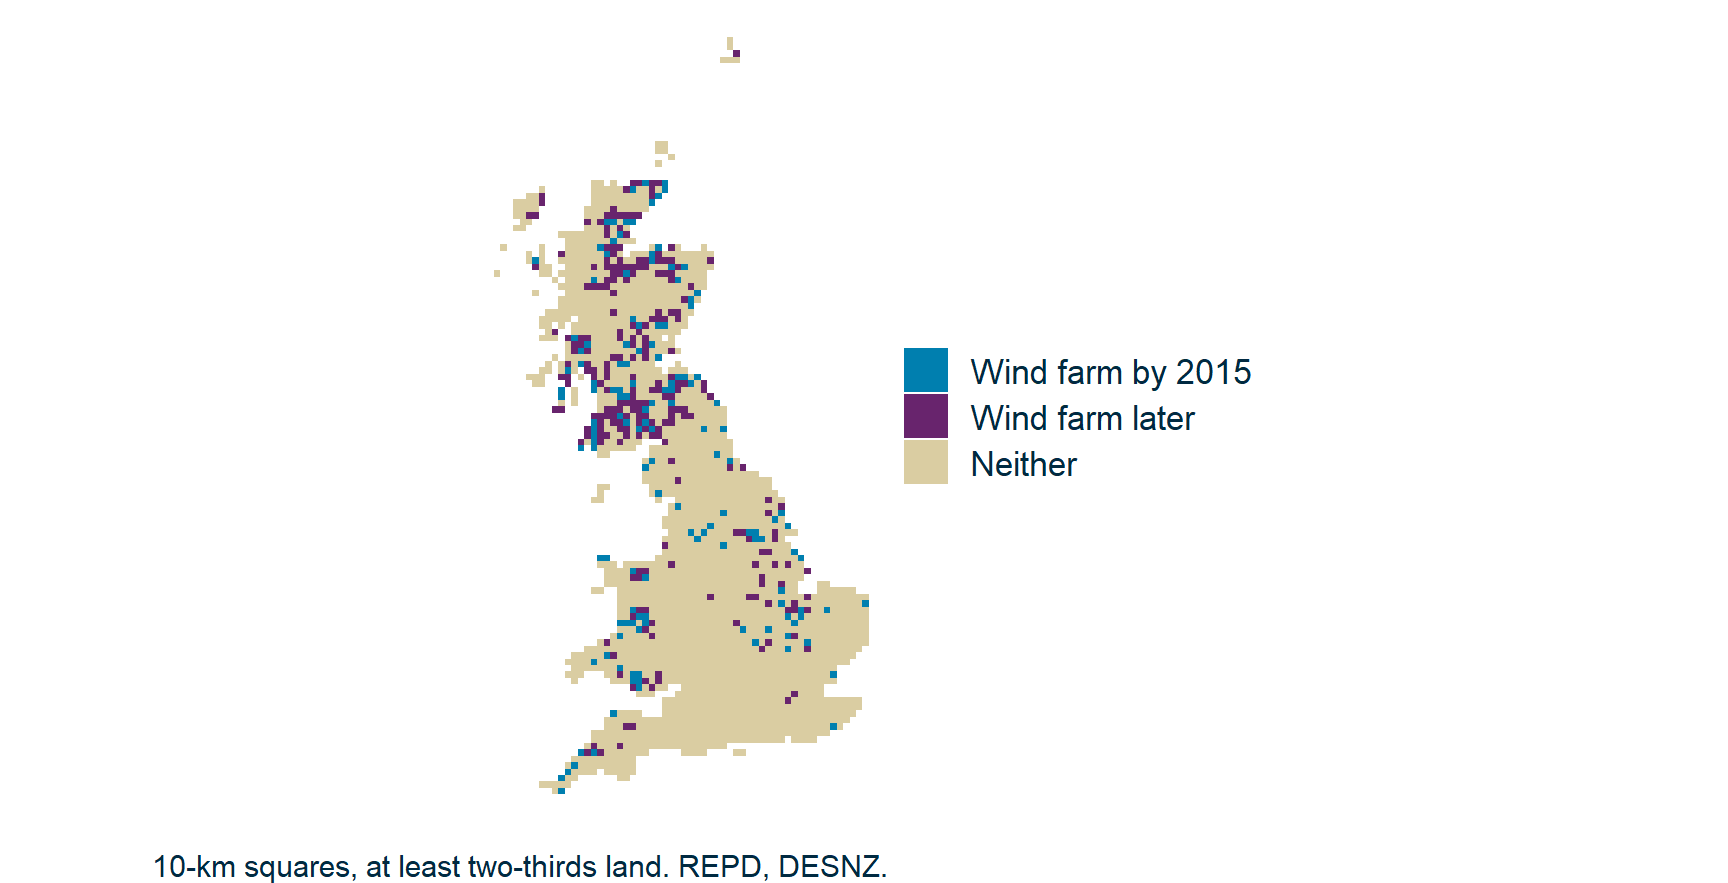
Map of Great Britain in 10-kilometre squares. Squares with a wind farm by 2015 are blue and squares where one was built or proposed later are purple. Both gather in the Scottish uplands, Wales, the Pennines and eastern England, with the later ones next to the earlier. The remaining squares are pale.

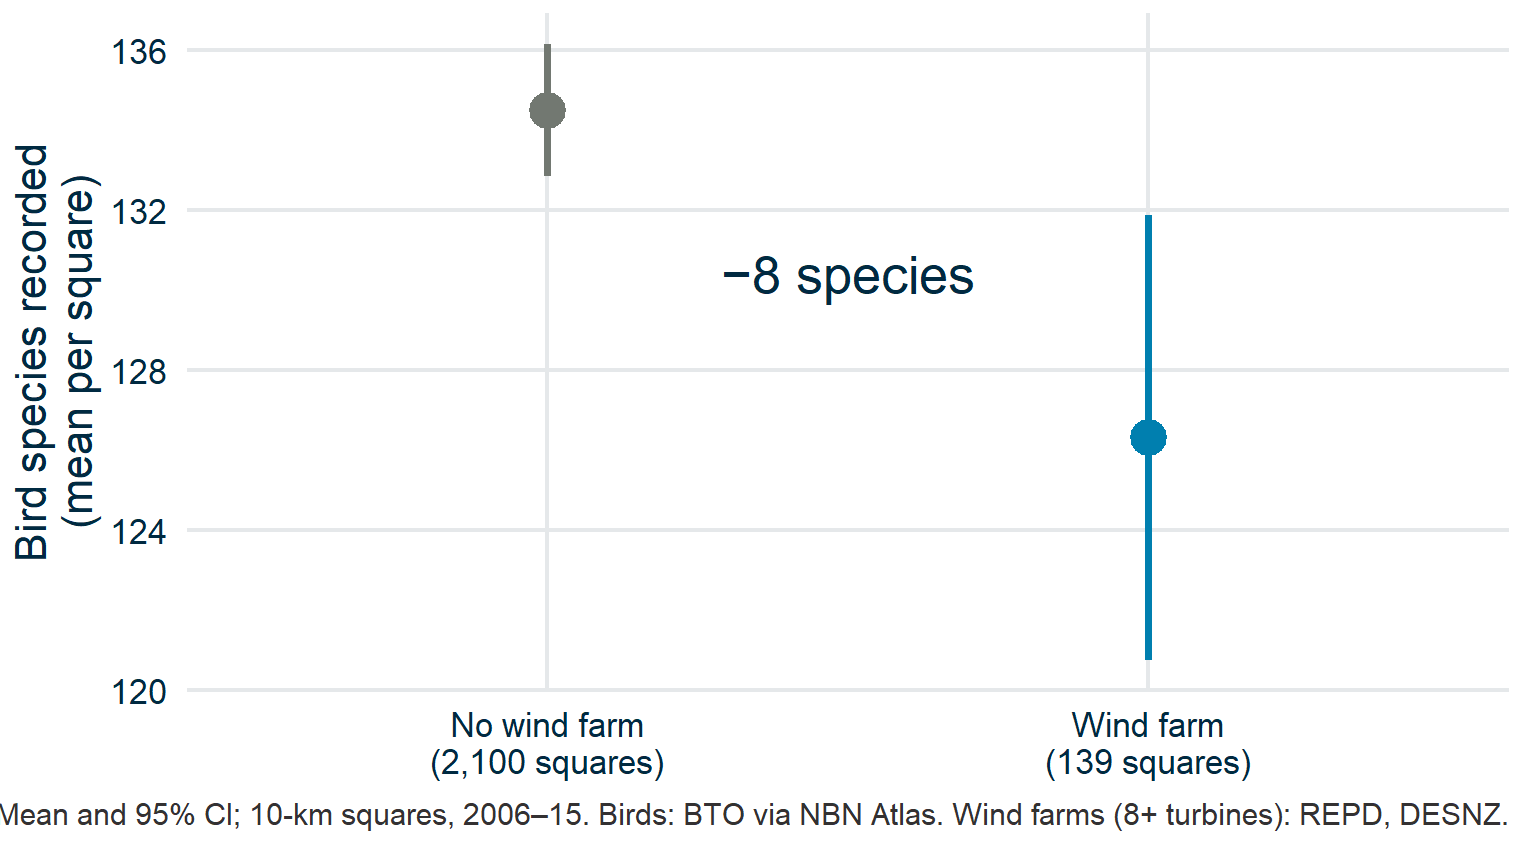
Wind farm squares have fewer species

Mean number of bird species recorded per 10-kilometre square, 2006 to 2015, with 95% confidence intervals. Squares with no wind farm average about 8 more species than squares with a wind farm.

Turbines harm birds?

Allowing for recording effort
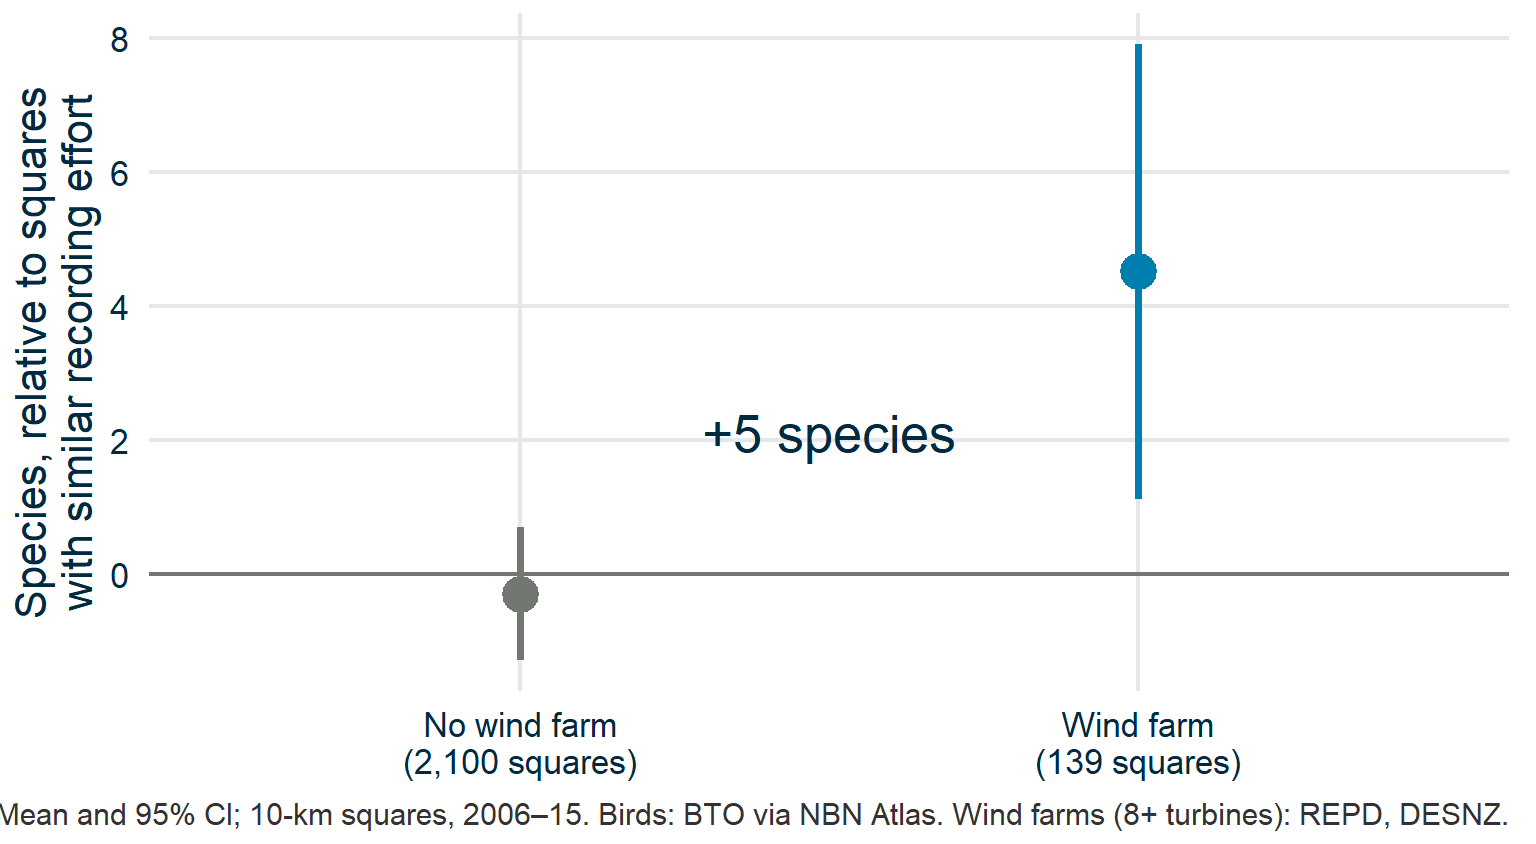
The same squares, now measured as species above or below the average for squares with a similar number of records. Wind farm squares come out about 5 species ahead of squares without.

Turbines help birds?

Before the turbines
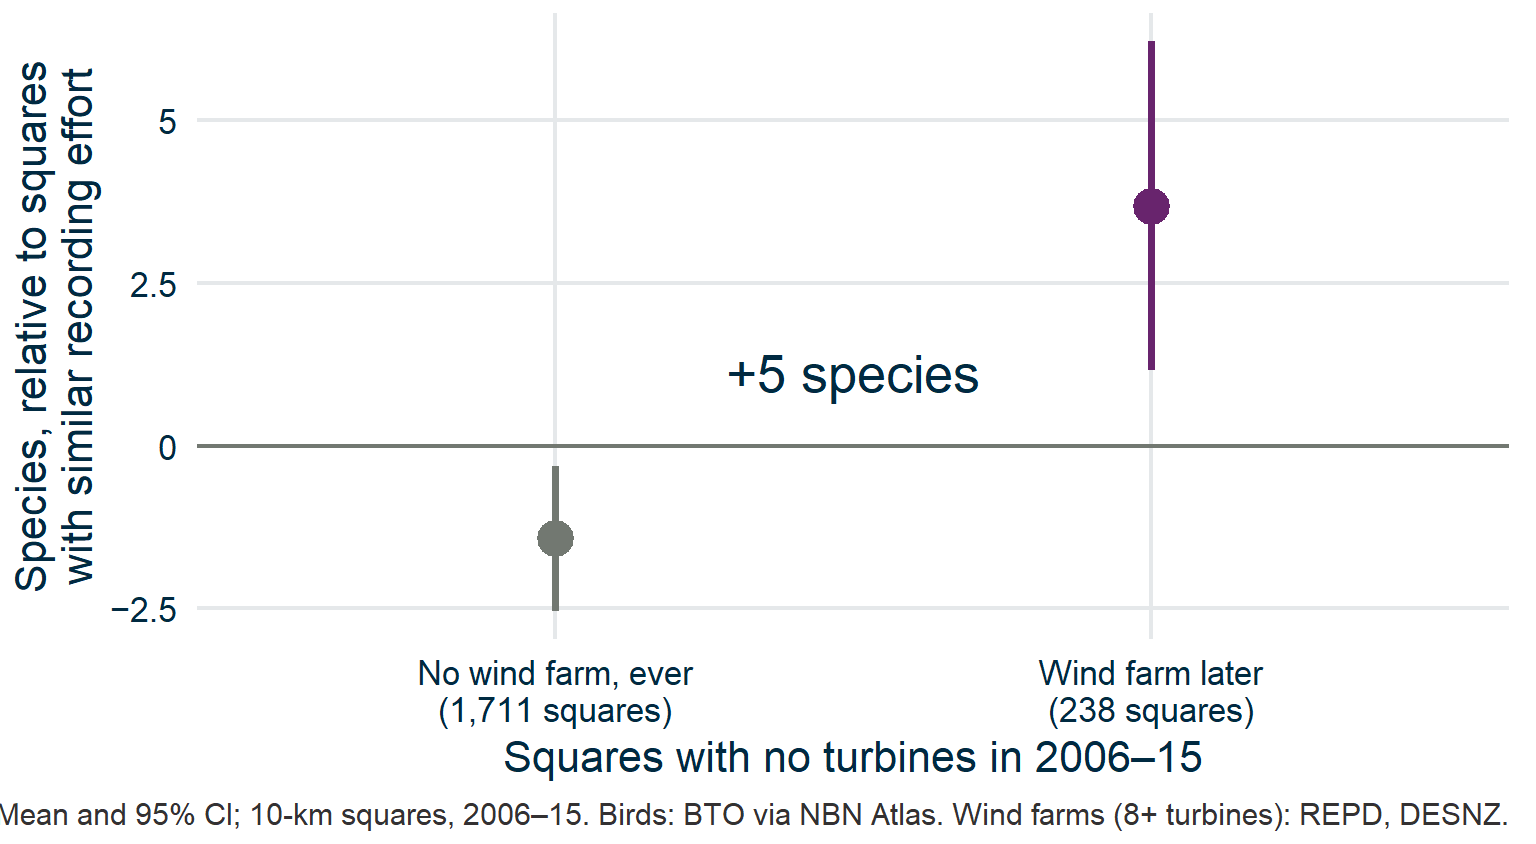
Only squares with no turbines at all in 2006 to 2015, split by whether a wind farm was later built or proposed there. Measured against squares with similar recording effort, the squares later chosen for wind farms already had about 5 more species.

The “benefit” was there before any turbine. Something else chose those squares.

What would a controlled experiment look like?

You fund wildlife research. Design the study that would tell you what wind farms do to birds.

Same sites, before and after

Pearce-Higgins et al. (2012) J. Appl. Ecol. 49: 386–394

Design

  • 18 upland wind farms, UK
  • Breeding birds counted before, during and after construction
  • Same counts on nearby reference sites with no turbines

Findings

  • Snipe −53% during construction
  • Curlew about −40%, with no recovery
  • No such declines on reference sites

How to handle confounders

  1. Randomization — when possible (rare in geoscience)
  2. Stratification — compare within subgroups
  3. Matching — pair similar observations
  4. Acknowledgement — when all else fails, be honest about what you can’t control

Spot the confounder

  • Welcome to Phase 2
  • What makes a good experiment?
  • HolmesCo’s site investigation
  • Confounding variables

💬✏️ Exercise 2

  • Sampling strategies
  • Design sketch
  • Wrap-up

Three scenarios

For each: identify the confounder and suggest how to address it.

1. “Communities near wind farms report more headaches than communities without wind farms.”

Confounders: rural/urban, age, awareness/nocebo effect, reporting bias.

Scenario 2

2. “Countries with higher nuclear capacity have lower carbon emissions per capita.”

Confounders: GDP, industrialization stage, energy mix decisions driven by geography and politics.

Scenario 3

3. “Students who use AI assistants score higher on coding assignments.”

Confounders: prior coding experience, motivation, time spent on assignments.

Sampling strategies

  • Welcome to Phase 2
  • What makes a good experiment?
  • HolmesCo’s site investigation
  • Confounding variables
  • Spot the confounder

🎓 Concept block 3

  • Design sketch
  • Wrap-up

How to choose your sample

Strategy How When
Random Every unit has equal probability Gold standard; often impractical
Stratified Sample within each subgroup Ensures representation
Systematic Every nth unit Regular grids, monitoring stations
Convenience Whatever’s easiest HolmesCo’s default

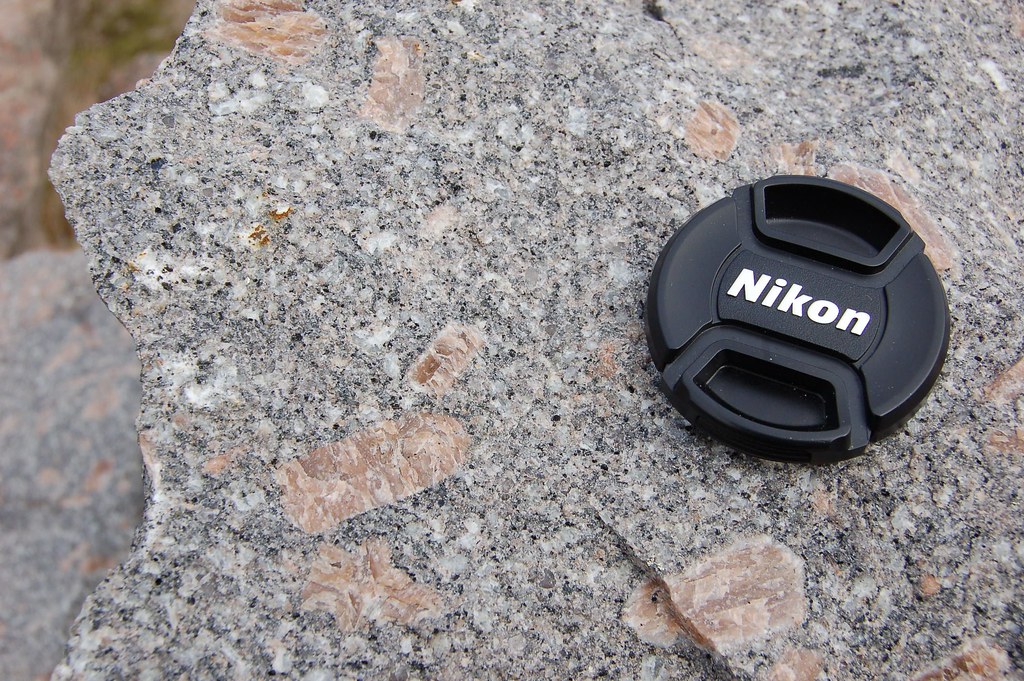
Close-up of Shap Granite: pink feldspar crystals several centimetres long scattered through a grey groundmass of much smaller grains, with a camera lens cap for scale.

Shap Granite. Sample a grain: which one?
jtweedie1976 / Flickr, CC BY 2.0

The same site, four ways
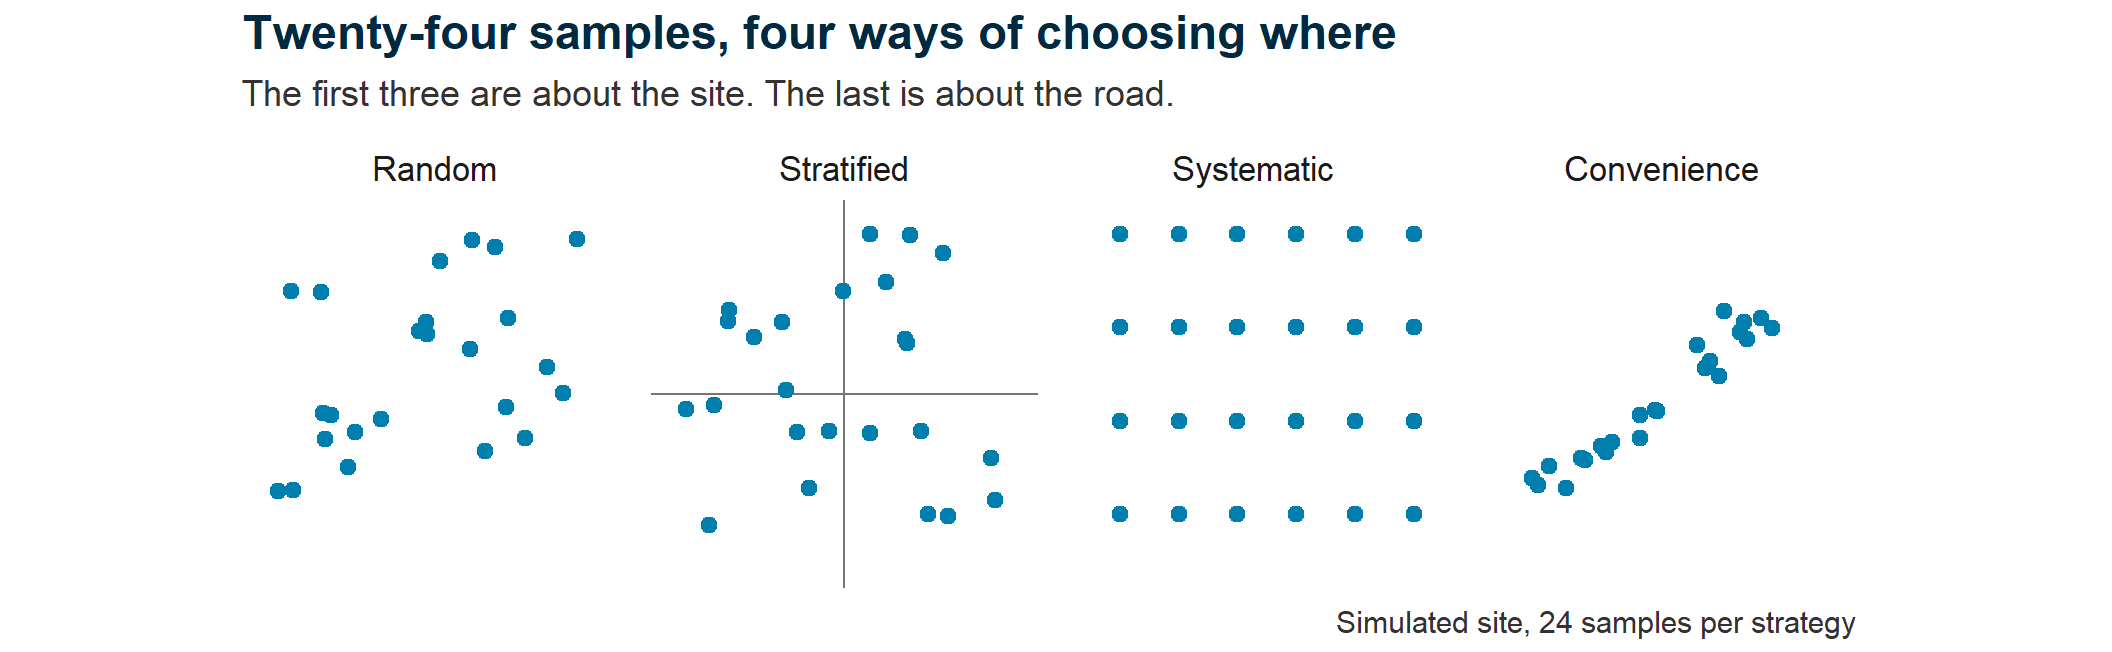
Four panels of a square site with 24 sample points each. Random scatters unevenly with gaps. Stratified splits the site in four and takes six from each quadrant. Systematic is a regular six by four grid. Convenience strings every sample along one diagonal line, leaving most of the site untouched.

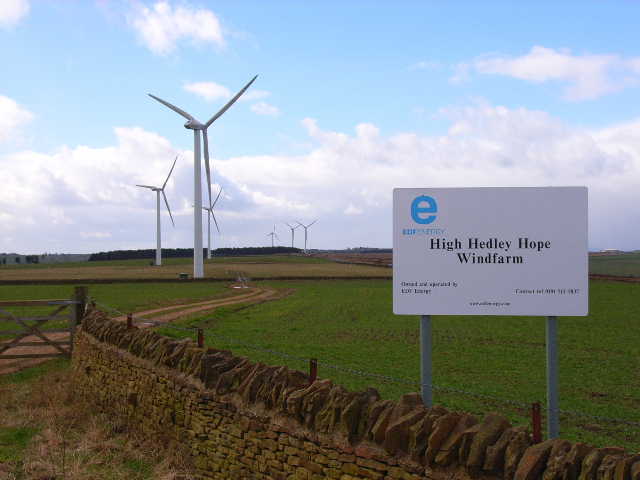
Wind turbines on open farmland behind a stone wall, with a sign reading High Hedley Hope Windfarm.

High Hedley Hope wind farm, County Durham.
Where on this site would you sample?
Oliver Dixon / Geograph, CC BY-SA 2.0

The HolmesCo default

“We sampled these because they were there.”

Honest — but weak.

Your sampling strategy is a decision you must justify in your report.

Design sketch

  • Welcome to Phase 2
  • What makes a good experiment?
  • HolmesCo’s site investigation
  • Confounding variables
  • Spot the confounder
  • Sampling strategies

✏️💬 Integrative exercise

  • Wrap-up

Choose your topic

Browse the available project topics.

Form provisional groups (3–4 people).

Pick a candidate topic. Then sketch:

  1. Question — what are you investigating?
  2. Data — what would you need?
  3. Comparison — what’s your control?
  4. Confounders — what should you worry about?

Wrap-up

  • Welcome to Phase 2
  • What makes a good experiment?
  • HolmesCo’s site investigation
  • Confounding variables
  • Spot the confounder
  • Sampling strategies
  • Design sketch

Key points

  1. Good design = clear comparison + controlled confounders
  2. Sampling is a choice you must justify
  3. HolmesCo’s mistakes are easy to make — watch for them in your own work

Any questions we missed?

Submit questions:

PollEv.com/geol

text geol to 07480 781235

Next time

Application session: “Planning your investigation”

  • Finalize groups and topics
  • Set up your group GitHub repo
  • Write a one-page research plan