Models and their limits
Research Skills — Week 8
Recap
Recap
- Bias bingo
- Linear regression
- Fit and interpret
- Assumptions and diagnostics
- HolmesCo’s regression
- The three failures of models
- Quick reflection
- Wrap-up
Where we are
You can now test hypotheses, compare groups, and quantify effect sizes.
This week: models.
A model is a simplified story about how the world works. The question is always: how much does it capture, and what does it leave out?
Questions?

Submit questions:
PollEv.com/geol
text geol to 07480 781235
Bias bingo
- Recap
Bias bingo
💬 Homework recap
- Linear regression
- Fit and interpret
- Assumptions and diagnostics
- HolmesCo’s regression
- The three failures of models
- Quick reflection
- Wrap-up
How did you do?
The Economist, 23 September 2026: “Many surgical interventions are little better than placebo”.
Hands up: a row? Two rows? Full house?
Which square was hardest to fill?
Why did surgeons think it worked?
Patients felt better after surgery. Three stories fit that:
- The operation fixed the problem
- The body healed on its own
- Being cared for made them feel better (placebo)
Pooling 100 surgical trials: about two-thirds of the improvement was stories 2 and 3.
How do you separate them?
| Compare | Isolates |
|---|---|
| Surgery vs sham surgery | the operation itself |
| Sham surgery vs no treatment | the placebo |
| No treatment, before vs after | natural recovery |
One 2002 trial splashed water into a dish so the sham sounded right.
Why were surgeons so sure?
- Patients who come back for check-ups are mostly the ones who got better
- Those who come back don’t want to disappoint their surgeon
- Surgeons’ predictions of who will improve: no better than a coin toss
The square most people missed
Scans find tears and “abnormalities” in knees, backs and shoulders.
The same abnormalities are common in people with no pain at all.
How plausible was this before we tested?
Now make it geological
| Surgery | Geology |
|---|---|
| Only recovered patients return | Dry holes and failed slopes never get written up |
| Patients heal anyway | Groundwater recovers once pumping stops. Did the remediation work? |
| Abnormal scans in painless knees | Faults are everywhere. Is this one why the ground subsided? |
| Surgeons have no uncertainty | Experts disagree on the same seismic section |
In geology nobody says the word “placebo”. Would you spot these?
Linear regression
- Recap
- Bias bingo
Linear regression
🎓💻 Concept block 1
- Fit and interpret
- Assumptions and diagnostics
- HolmesCo’s regression
- The three failures of models
- Quick reflection
- Wrap-up
What is a model?
A deliberate simplification that captures some features of reality and ignores others.
Every statistical test you’ve run contains an implicit model.
The t-test models data as two normal distributions with equal variance.
Now we make the model explicit.
Linear regression
\[y = \beta_0 + \beta_1 x + \varepsilon\]
“y increases by β₁ for every one-unit increase in x, plus noise.”
That’s the whole model. It’s powerful — and limited.
Live demo
Reading the output
| Element | Meaning |
|---|---|
| Intercept (β₀) | Predicted y when x = 0 |
| Slope (β₁) | Change in y per unit change in x |
| R² | Proportion of variance explained |
| p-value (slope) | Is the slope distinguishable from zero? |
Fit and interpret
- Recap
- Bias bingo
- Linear regression
Fit and interpret
✏️💻 Exercise 1
- Assumptions and diagnostics
- HolmesCo’s regression
- The three failures of models
- Quick reflection
- Wrap-up
Solar panels and temperature
Solar panel output vs temperature — counterintuitive.
- Make a scatter plot
- Fit
lm() - Interpret the slope and R²
- Plot the fit
Is the relationship linear? Does the model capture the pattern?
Attendance
Assumptions and diagnostics
- Recap
- Bias bingo
- Linear regression
- Fit and interpret
Assumptions and diagnostics
🎓 Concept block 2
- HolmesCo’s regression
- The three failures of models
- Quick reflection
- Wrap-up
The four assumptions
- Linearity — the relationship is actually linear
- Independence — residuals don’t influence each other
- Homoscedasticity — constant variance of residuals
- Normality of residuals (for inference)
Diagnostic plots
Four plots, two that matter most:
| Plot | What to look for |
|---|---|
| Residuals vs Fitted | Pattern = non-linearity or heteroscedasticity |
| QQ plot | Departures from the line = non-normal residuals |
HolmesCo’s regression
- Recap
- Bias bingo
- Linear regression
- Fit and interpret
- Assumptions and diagnostics
HolmesCo’s regression
✏️💬 Exercise 2
- The three failures of models
- Quick reflection
- Wrap-up
The scenario
HolmesCo
“Geological Solutions Since 2019”
Groundwater Analysis Report
Linear model: groundwater level ~ rainfall. R² = 0.49.
“Rainfall is the dominant control on groundwater levels.”
Now look at the diagnostic plots…
What’s wrong?
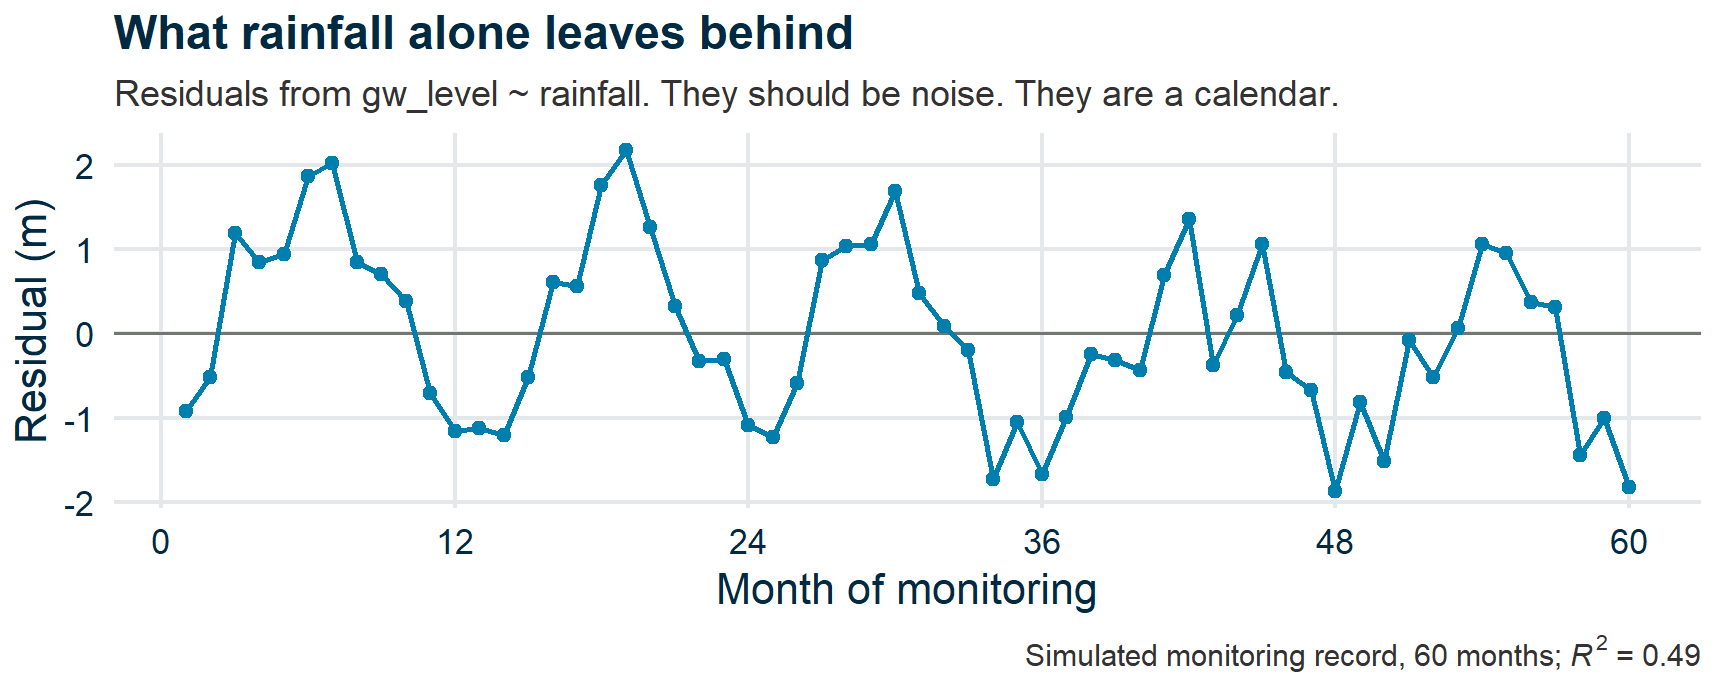
- The residuals show a seasonal pattern — the model is missing a time-dependent structure
- R² = 0.49 means 51% of the variation is unexplained
- “Dominant” is a stretch when your model misses more than it captures
The three failures of models
- Recap
- Bias bingo
- Linear regression
- Fit and interpret
- Assumptions and diagnostics
- HolmesCo’s regression
The three failures of models
🎓💬 Concept block 3
- Quick reflection
- Wrap-up
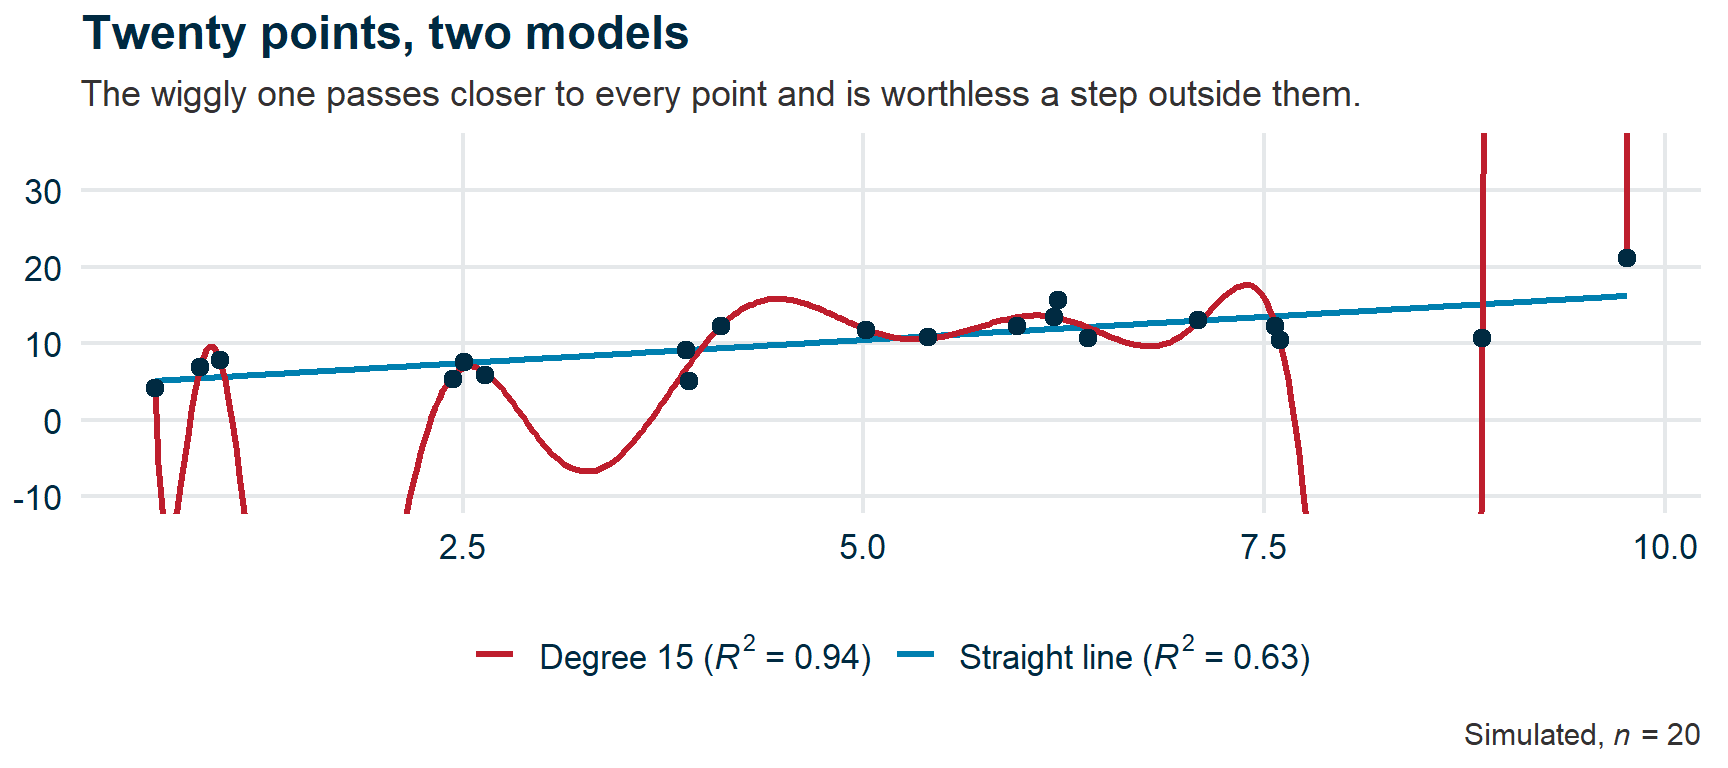
Failure 1: Overfitting
A model that fits the training data perfectly but fails on new data.
It’s memorized the noise.
Demo: polynomial degree 15
🖥️ Live demo
Fit a degree-15 polynomial to 20 data points. It goes through every point but oscillates wildly between them.
Compare to the straight line: fits worse, predicts better.
More complex ≠ more useful.
What that looks like
Failure 2: Extrapolation
A model that works within the observed range but breaks down outside it.
Example: UK solar capacity has grown roughly exponentially since 2010. Extrapolate to 2050 → solar exceeds the entire UK grid.
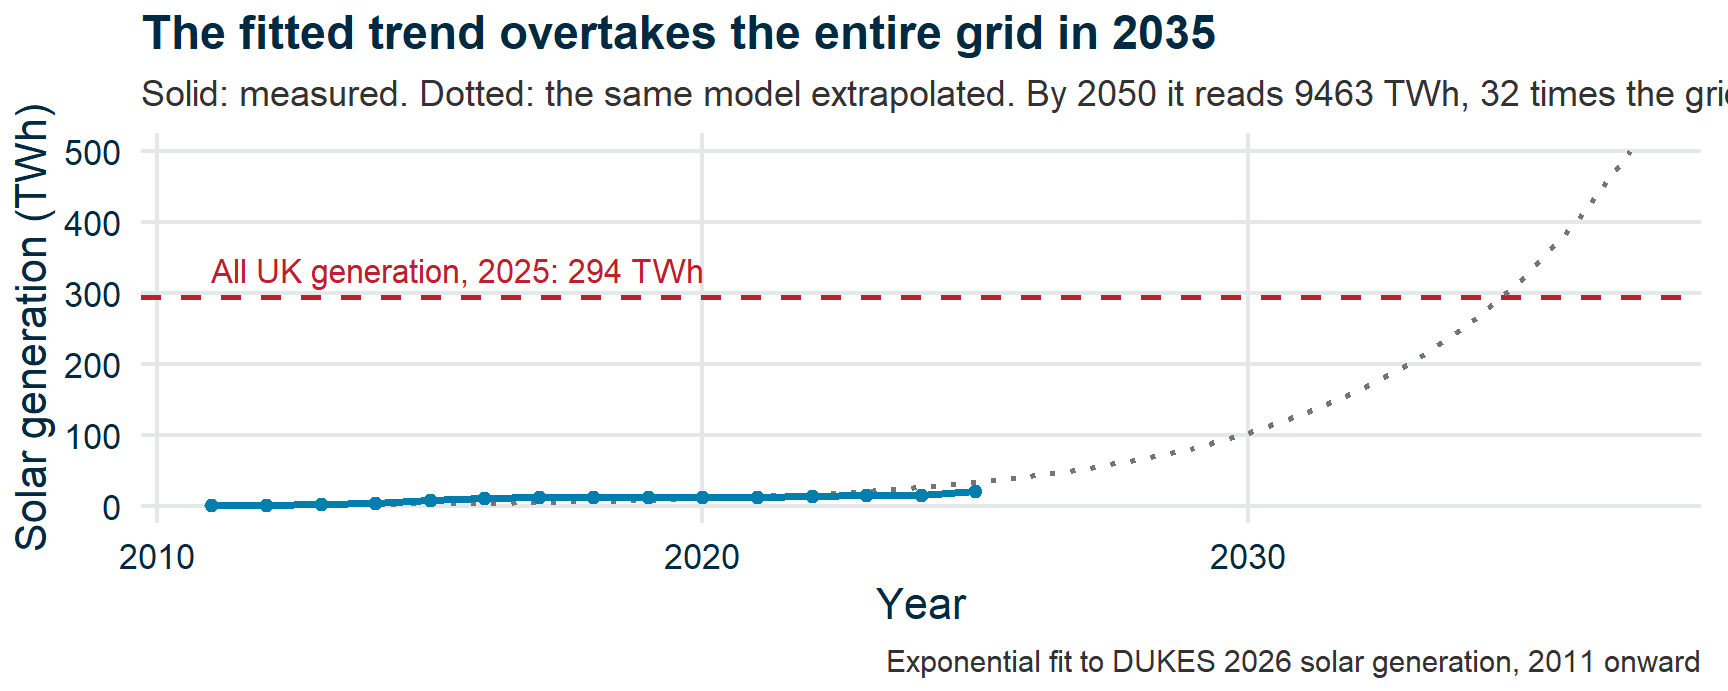
What’s the model not capturing?
Planning constraints, grid limits, diminishing suitable sites.
HolmesCo’s extrapolation
HolmesCo
“Geological Solutions Since 2019”
“Our linear trend in groundwater decline predicts the aquifer will be empty by 2028.”
They didn’t account for seasonal recharge or the fact that the decline was caused by temporary pumping.
Failure 3: Blind spots
Things the model structurally cannot represent.
- A single-turbine power curve has no term for wake interference → overpredicts wind farm output by 10–20%
- A carbon accounting model that counts biomass as zero structurally cannot see the emissions it ignores
You can only fix a blind spot if you know it’s there.
The new refrain
“What is the model not capturing?”
Overfitting: too much faith in your data.
Extrapolation: too much faith in your model.
Blind spots: too much faith in your framework.
Quick reflection
- Recap
- Bias bingo
- Linear regression
- Fit and interpret
- Assumptions and diagnostics
- HolmesCo’s regression
- The three failures of models
Quick reflection
✏️ One sentence
- Wrap-up
Write one sentence
“In my project, the biggest thing my analysis might be missing is…”
Wrap-up
- Recap
- Bias bingo
- Linear regression
- Fit and interpret
- Assumptions and diagnostics
- HolmesCo’s regression
- The three failures of models
- Quick reflection
Wrap-up
Key points
- A model is a simplification — powerful, but limited
- Always check the diagnostics: residuals don’t lie
- Three failures: overfitting, extrapolation, blind spots
- Always ask: “What is my model not capturing?”
Any questions we missed?
Submit questions:
PollEv.com/geol
text geol to 07480 781235
Next time
Application session: “Fitting and breaking models”
You’ll fit models to your data — and deliberately try to break them.